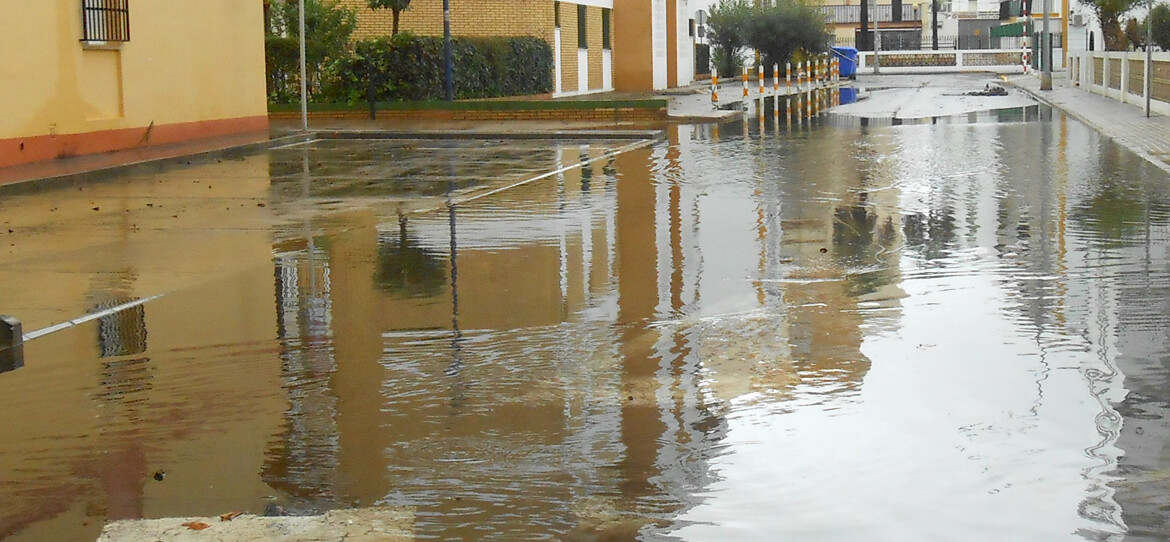
In the past twenty-five years there has been a significant rise in flood risk on the Mediterranean coast due to the increase in vulnerability and exposure to the hazard of heavy rains. This reflects the effects of urban expansion from 1990 to the present day, especially in the years of the so-called “property boom” which has made this part of Spain the European region with the highest volume of building activity over the period. The occupation of areas in danger of flooding stands out as the chief cause of the rise in risk.
Jorge Olcina Cantos. University of Alicante Alfredo Pérez Morales. University of Murcia Antonio M. Rico Amorós. University of Alicante Salvador Gil Guirado. University of Murcia Francisco López Martínez. University of Murcia
1. Vulnerability and exposure, key elements in the increase in flood risk on the Mediterranean coast
In recent decades there has been an observable rise in the strength, frequency and economic impact associated with flooding in Europe (Barredo, 2007; Marchi et al., 2010). Some commentators suggest that this heightening of severity is more attributable to socio-economic factors than any that relate to atmospheric conditions themselves (IPCC, 2014). The report from the European Environment Agency on climate change impacts (EEA, 2017) stresses the significance of the “vulnerability” factor as key to approaching the issue of climate change adaptation and the likely increase in flood events on European soil up to the end of the century. It says that between 2000 and 2014 there have been some 2,000 fatalities in Europe on account of the effect of flooding and around 8.7 million persons affected. Under the SRES A1B family of climate scenarios it is estimated that in 2050 those affected by floods in Europe will probably number 300,000 and reach 390,000 from the 80s in the present century (EEA, 2017).
Against this backdrop, vulnerability, the social factor implied in the risk equation defined by Wisner et al. (2004), takes on special importance in time-space variations in flood risk. Nonetheless, when social elements come into play, assessing the contribution made by this factor becomes very complicated, among other aspects because there is still no consensus on a definitive definition of it (Gil-Guirado et al., 2016).
On this point, approaches to the term have undergone a steady process of evolution and vulnerability has shifted from being understood as a mere concept associated with a certain amount of loss we can expect as a function of the resistance of what is exposed, to something far more complex and intimately related to social processes (ISDR, 2005). Since then attempts at definition and explanatory models have followed each other (e.g. Calvo, 2001, Wisner et al., 2004, Parker et al., 2009). As things stand, it seems that today it is generally accepted that vulnerability should be a society’s capacity to combat the hazard (IPPC, 2014). This means that risk has come to be viewed as a social construct (Fusch, 2009) where the hazard is understood to be a constant (at least as far as floods are concerned) and variation in it depends more on a value of vulnerability which is arrived at from a set of inter-related factors such as the economy, politics, education, etc. with substantially varying degrees of significance depending on the commentator in question (Table 1). In other words, among these factors there are a series of synergic or conflicting relationships, the weighted relevance of which represents the final value of vulnerability (Wilches-Chaux, 1993).
Table 1. Different aspects of vulnerability
Source
Aspects of vulnerability
Brief description
Wilches-Chaux (1993)
Environmental
Environmental bounds (temperature, humidity, pressure, etc.) within which life is possible.
Physical
Spatial location and presence of anti-risk measures.
Economic
Income levels.
Social
A community’s level of internal cohesion.
Political
Autonomy in decision-making.
Technical
Technological development of a society.
Ideological
Perception of our surroundings.
Cultural
The society’s particular characteristics.
Educational
Available disaster information.
Ecological
The planet’s self-righting mechanisms to offset the effects of human beings.
Institutional
Breaking the link between institutions, the environment and the needs of citizens.
Parker et al. (2009)
Physical
Potential damage to structures, buildings, infrastructure, properties or support.
Systemic
Where and how an event might spread through systems and proneness to incapacity to function.
Social
Relates to different levels of society.
Economic
Loss of economic assets and productivity.
Territorial
Implies a unity of space and territoriality.
Institutional
Possible consequences of critical deficiencies of institutions and institutional arrangements.
Organisational
Presence of social organisational structures.
Cultural
Loss of beliefs, customs, artefacts and indigenous life styles.
Calvo (1997)
Economic conditions
Levels of income to face up to disasters.
Social cohesion
Presence of organisations.
Law and the political framework
Existence of laws.
Technical resources
Infrastructure protection.
Cultural/educational
How much information people have.
"Media impact"
How disasters are covered in the media.
Smith and Petley (2009)
Economic
Income and level of services.
Social
Personal characteristics.
Political
Existence of a centralised government.
Environmental
Unsustainable management of natural resources.
Geographical
Distance to help areas.
Fusch (2009)
Structural
Degree of loss from the impact of a specific event on elements at risk.
Economic
Capacity of exposed assets and securities to recover.
Institutional
Political system and related institutional structures.
Social
People’s personal characteristics.
IPCC (2012)
Environmental
Associated with the nature system (vulnerability, impacts, mechanism and responses).
Social
Social organisation and collective aspects.
Economic
Incapacity of persons affected, communities and businesses.
Wisner et al. (2004)
Fundamental causes
Capacity of governments to absorb and cushion damage.
Dynamic pressures
An inter-related set of widespread and general processes within a society and the world economy.
Unsafe conditions
Processes and activities that "translate" the effects of root causes both temporarily and spatially into unsafe conditions.
Cutter (2003)
Biophysical
The specific ways in which the vulnerability of a population reveals itself over time in combination with the hazard.
Social
Areas exposed to danger.
Lebel et al. (2011)
Sensitivity
Product of social inequalities, government and their capacity to respond.
Capacity to respond
Degree to which the system is affected by the disturbance or stress.
Source: López et al., 2017.
Given the difficulty of knowing to what extent each of these has a bearing on final vulnerability (Calvo, 2001; Tate, 2013), an appropriate way to approach study of this is via a qualitative analysis based on explanatory models that can be reproduced spatially, such as the MOVE framework (Birkmann et al., 2013). This embraces concepts from various different authors and summarises global vulnerability facets into six broad groups: physical, ecological, social, economic, cultural and institutional. The combination of these in an exposed environment determines the risk level which, if it is to be mitigated, must be dealt with by effective territorial governance measures. Correct adaptation to the hazard leading to overall improvement of the system hinges on organised and effective implementation of such measures. In this regard there is no doubt about the significance of the role performed by the various arms of government charged with directing the capacity to adapt to environmental hazards. Despite this supremely important responsibility which rests with government agencies (Giddens, 2002), there are certain regions where this situation is far from being the case (Thailand, Lebel et al., 2011; Burby, 2006, USA; the Netherlands, Jongman et al., 2014). By way of example, certain papers have demonstrated the potential influence of agencies in exacerbating the effects of the hazard concerned. This can arise from an increase in vulnerability: Adger (2006) showed that social vulnerability is enhanced by certain institutional and economic factors associated with Vietnam’s economic transition from central planning; or else from ineffective management which leads to heightened exposure: Fuchs et al. (2015 and 2017) showed that the current exposure level in Europe’s Alps (Austria and Switzerland) does not depend exclusively on the environment as a factor but that it also relates to economic activities and the various weaknesses in measures established (both structural and non-structural). Likewise Pérez et al. (2015a) highlighted that the increase in exposure to flooding on the Spanish Mediterranean coast correlates positively with periods of economic growth and legal laxity.
Given the importance described of the role of institutions and risk governance, we believe attention should focus on Institutional Vulnerability as both a concept and a factor (hereafter “IV”). This has also been studied by several commentators (Renn, 2008; Raschky, 2008; Parker et al., 2009; Fusch, 2009). Put fairly succinctly, these two aspects are conceived as "the inefficiency of the various authorities in charge of risk management where their results imply a rise in the exposure of societies, in other words increased risk". IV encompasses agencies and organisations that are either entrusted with risk management (for example, governments, civil protection, warning systems, territorial planning) or associated with it (e.g. risk reporting, NGOs, health service systems, education and research centres) (Wisner, 2000) and influences other vulnerability factors (Wilches-Chaux, 1993), as well as various different internal limitations (e.g. technical, legislative, personnel-related) and external pressures (e.g. of a political, social or employment-related nature).
The study case we are concerned with here is a clear example where those obstacles that hinder proper implementation of planning are more striking than the ways in which it is helped. Among others, there are economic interests that arise from mass occupation of the land, which prevail above effective application of measures to mitigate flood damage (Iglesias, 2007). The process that has triggered this can mainly be put down to the fact that Spain’s Mediterranean coastline is one of the world’s top tourist destinations (WTO, 2016). Specifically, a population of some 6,312,997 inhabitants live in all of the municipalities together along Spain’s Mediterranean coast between Águilas (Murcia) and Portbou (Girona) (López et al., 2016), yet if we consider the entire population in these regions (Murcia, Valencian Community and Catalonia), the figure climbs to almost 14 million inhabitants (13,947,411 inhabitants in 2016), representing 30% of the population nationwide. This socio-economic dynamic was incentivised by regional and municipal governance that clearly favoured zoning activity aimed at incorporating all of this population and creating new areas, and in at least two periods starting in the 70s which were interrupted by the crisis in the 90s, the number of buildings multiplied by eight (Pérez et al., 2015a). The territorial planning pursued over this time has manifestly proved itself to be inefficient and this shows through negatively in the form of a hefty catalogue of problems (Aledo et al., 2007) among which is flooding. Obviously, with due consideration not having been given to zones prone to flooding, the resulting losses from water surges have steadily risen (Gil-Guirado, et al., 2016), even ahead of the contribution that might have been made by climate change to exacerbating the frequency of events involving a heavy hourly rainfall (IPCC, 2014).
On account of everything we have mentioned here, the case of the coast appears to be a good example to use to conduct a study of the contribution of IV to increasing risk. The paper is organised according to this premise, and in the second section we look at everything that relates to the physical factor as regards the variability of precipitations and the changes that might be taking place in the severity of these. In the third section we assess Institutional Vulnerability via two complementary methods that focus quantification on the effectiveness of territorial zoning and planning to mitigate exposure to flood hazard. Lastly, in the fourth and final section, we set out a series of conclusions and recommendations based on the results obtained.
2. Changes in precipitation: increase in intensity levels
The increase in vulnerability has been joined by a change in the hazardousness of rainfalls as a natural factor behind floods. This is not so much on account of the increase in volumes of water involved in these events, but because of the “quality”, i.e. the kinds of precipitations that have given rise to flood events in recent decades. Indeed, there has been an observable change in the way rain has happened that has brought about water-logging and flooding involving losses both financially and in terms of human lives. Precipitations are being recorded that are more concentrated timewise and with a rainfall level that is not as high as the precipitations that caused major flood events in the 80s or the 90s in the last century.
Various studies (CEDEX, 2012; Marcos García and Pulido Velázquez, 2017; Serrano Notivoli, 2017) in recent years have charted the course of changes in precipitation occurring across the whole Iberian peninsula which have usually shown falling trends for rainfalls, although this has not been uniform and evenly spread over the whole of Spanish soil, as well as a rise in precipitation strengths that appears particularly marked along the Mediterranean coast.
The year-on-year and intra-annual irregularity of rains is a characteristic feature of Mediterranean precipitation. And on top of this, a concentration of rains within a short space of time. This is a key aspect when it comes to territorial planning and especially the infrastructure required to drain off water in urban environments to reduce flood risk. Together with the tropical climates due to the genesis of tropical cyclones or of monsoon-type rains, Spain’s Mediterranean coast is one of the striking in the world in terms of readings for daily and hourly rainfall intensity.
The bouts of significant flooding, with considerable economic losses and human victims that have occurred since 1950 have been caused by the advent of days of torrential rain with extremely high recorded precipitation rates of generally over 200mm in 24 hours. The official readings for rainfall in 24 hours in the territory along Spain’s Mediterranean coast show record values of over 300 or 400mm, yet there are some places which have comfortably surpassed this figure and doubled or tripled this daily accumulated volume of rain (see table). All of these cases have occurred in highly unstable weather (cold air at higher levels; troughs, cut-off upper-level lows). The list of extreme rainfall rates of over 400 mm/24 hours includes (see table):
Table 2. Extreme rainfall values of over 400 mm/24 h along Spain’s Mediterranean Coast
DATE
LOCATION
PRECIPITATION in 24 hrs. (mm)
20 October 1982
Casas del Barón (Valencia)
1,121 (estimated)
2 October 1957
Javea (Alicante)
871 (not recognised)
3 November 1987
Oliva (Valencia)
817
4 November 1987
Pobla del Duc (Valencia)
790
3 November 1987
Gandía (Valencia)
720
20 October 1982
Bicorp (Valencia)
632
11 September 1998
Tavernes de Valldigna (Valencia)
520
4 November 1987
Sucamarcer (Valencia)
520
11 September 1996
Benifairó de Valldigna (Valencia)
500
10 October 1994
Alforja (Tarragona)
450
14 October 1986
Cadaqués (Girona)
430
20 October 1982
Cofrentes y Jalance (Valencia)
426
3 November 1987
Denia (Alicante)
425
12 October 2007
Alcalalí (Alicante)
416
7 May 1982
Vall de Gallinera (Alicante)
412
6 November 1983
Alginet (Valencia)
410
1 October 1957
Cabo de San Antonio (Alicante)
409
Source: AEMET, Gil Olcina and Olcina Cantos (2017). Own research.
The geographical area most affected by these torrential downpour levels lies between the north of the province of Alicante and the south of Valencia (La Marina Alta and La Safor districts). Even so, very high values of cumulative rainfall in 24 hours can be found in the other provinces along Spain’s Mediterranean coast. Thus, no area along this strip of the peninsula is spared from the possibility of very heavy rains in conditions of high atmospheric instability, although geographical determinants (presence of height differentials in the terrain, the path taken by the coastline relative to prevailing winds in conditions of instability) do affect the amounts that can be recorded.
Notwithstanding this, the possibility in the past few years of having hourly precipitation readings with the installation of intensity rain gauges or pluvio-graphs, the State Meteorological observation network or hydrological reporting systems in the Spanish hydrographic areas has made it possible to know which kinds of rainfalls happen in flood events with greater detail. There is one really surprising piece of data concerning the maximum daily rainfall in the south-east of the Iberian peninsula, which is the estimated figure during the well-known Saint Theresa Flood during the night of the 14th to the 15th of October 1879, which is the greatest in recorded history in the Segura basin, and on the river Vélez, which is one of the branches at the head of the river Guadalentín, more than 600mm are supposed to have accumulated in one hour. The municipality of Sueca (Valencia) is on record as having the highest intensity in Spain over the space of two and a half hours (at 296mm, on 23 September 2008). In 20 minutes the weather station in the Automatic Hydrology Reporting System (SAIH) that is located in the Valencian municipality of Manuel recorded 90.6mm on 1 August 1993. And in just one minute, the greatest intensity ever recorded in Spain was in Montserrat (Valencia) on 10 October 2008 (10.2mm).
In his study of rainfall in Spain, Serrano Notivoli (2017) noted a significant negative trend in analysis of the maximum annual precipitation in one day across the whole Iberian peninsula for 1950-2012. This means that there is less cumulative volume of overall precipitation in the most extreme events. He nevertheless finds a positive trend in the contribution of intense rainfall to cumulative annual totals, which serves to indicate that intense rain episodes are more frequent although the volume accumulated in them is smaller. This ties in with the analysis carried out in this paper for the case of Alicante (see section 3).
The study on extreme rains in Spain for 1805-2014 made by Gonzalez and Bech (2017) shows that the highest readings for precipitation within a short time interval (10 to 60 minutes) have been recorded in the past two decades, while the record data for torrential rain (above 300mm) registered in an observatory in the AEMET national network is from before 1990. This means that no record of an absolute maximum amount has been beaten in the last twenty years, although data on intense falls within a short time interval have become more frequent. What stands out is that such record rainfall readings in under 60 minutes have been registered at weather stations located either on the Mediterranean shoreline or in the Canary Islands.
These are (hourly) rainfall intensity readings that have to be known for the purpose of gauging the evacuation capacity of drainage networks in the cities on the Mediterranean coast and, although they appear really high and represent an undoubted rise in the cost of public drainage, they are readings that mean safeguarding human life and avoiding high economic losses for these urban areas.
It should also be borne in mind that this aspect of increased hourly precipitation intensity will be a major feature of rainfall in this part of Spain in the coming decades if the models of climate change are borne out.
Several population centres on Spain’s Mediterranean coast have recorded flood events in the last few years that have been caused by strong bursts of rain where the amount that has fallen varies between 50 and 150mm and which have come down in barely 60-90 minutes. By way of recent data, the cities of Malaga (56mm in 1 hour) and Girona (53mm in 30 minutes) showed high economic losses due to the effect of these types of intense rain events with flooding in December 2016 and June 2017 respectively. Likewise, the city of Alicante recorded an intense rain event in March 2017, which had originated from high level cold air pockets (gota fría, or cut-off upper level lows) at a time of year that was not very given to such events (winter) and caused water-logging and flooding, prompting the start of the flood prevention works which have been going on in the municipal district following the serious event that took place on 30 September 1997.
The city of Alicante, which might serve as an example of what has been happening on Spain’s Mediterranean coast, especially along its southern part, has suffered repeated bouts of flooding in its urban section and in the municipal district in recent decades. As regards the series of major flooding episodes that have assailed the city in the past few decades, it has been confirmed that since 1980, except for the two events mentioned, the city has been subjected to substantial waterlogging and flooding from heavy rainfalls that are either no more than or just over 100 mm/24 hrs. These are in fact rains that last for an hour or so and where the maximum amounts of rainfall build up in barely 60-90 minutes (see table).
Table 3. Intense rainfalls which have resulted in waterlogging or flooding in the city and district of Alicante between 1980 and 2017
DATE
CUMULATIVE PRECIPITATION (mm)
20 October 1982
233,1 mm
4 November 1987
92 mm
5 September 1989
133,6 mm
30 September 1997
270,3 mm
3 May 1999
35 mm
23 October 2000
55,4 mm
21 September 2007
90,4 mm
11 y 12 October 2007
49,7 mm y 42,1 mm
28 September 2009
131 mm
18 November 2012
55,2 mm
13 March 2017
137,4 mm
SOURCE: AEMET. Alicante observatory. (Ciudad Jardín).
Shaded area shows episodes caused by rainfalls with intensive hourly downpours, concentrated timewise and featuring an amount of under 150mm/24 hrs.
The most hazardous rains as regards flood-forming are those where there is a concentration of up to 100 or 150 litres in barely 2-3 hours. For these types of precipitations the existing urban drainage systems in cities on Spain’s Mediterranean coast are not effective as they are not designed to cater for hourly downfalls of this magnitude. This aspect of change in rainfalls (more frequent intense downpour events), together with the increase in institutional vulnerability, with excess occupancy of areas at risk of flooding, is to an extent responsible for the rise in economic losses from flooding along Spain’s Mediterranean coast and in the Canary Islands.
3. Increase in exposure and vulnerability: case study
3.1. Rise in institutional vulnerability
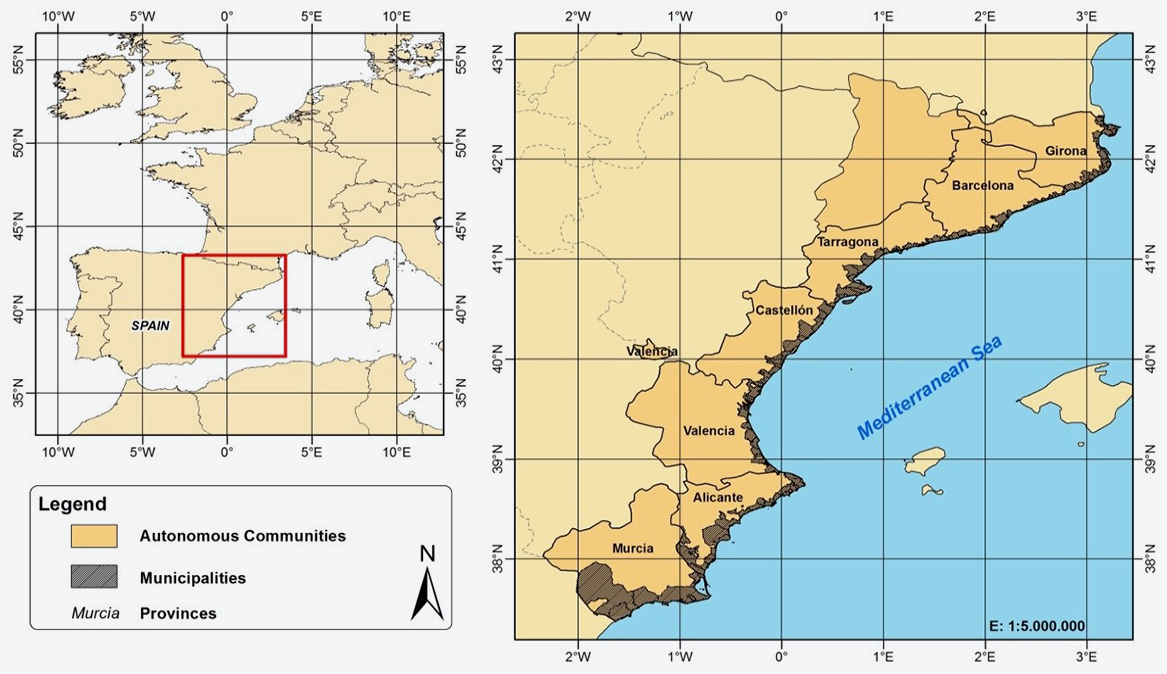
Figure 1. Study area.
Since the mid-50s in the past century, the regulations regarding territorial zoning in the area under review have witnessed a progressive incorporation of natural risk analysis (1). Nonetheless, unlike what happens in other countries such as France, Greece or Italy, in Spain there is no state framework legislation on natural risks. This legal silence has given rise to administrative dispersion of authority in the matter of managing flood risk among various disparate sets of regulations with differing sector impacts (land, water, the environment, natural resources etc.) (Olcina, 2010a).
At the moment, according to Spanish administrative and political organisational arrangements, the State, the regions and the municipalities are the arms of government that are in charge of territorial and urban planning (2). Even so, while the State alone can opine on basic conditions, the regions are responsible for approving territorial and urban zoning regulations. These in turn confer their authority upon the municipalities. It is thus ultimately the municipalities who are in charge of putting into practice and deciding their policies as regards urban growth by defining how land is used via municipal planning means at their disposal.
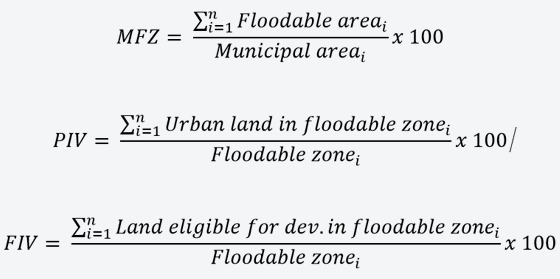
In this article we propose a methodology for calculating Institutional Vulnerability (IV) in the area we review. This is carried out by a simple procedure of relating spatial planning information and the areas affected by 100-year (i.e. occasional) flooding. The intersection of both layers of information using a GIS enables the area understood as having IV to be shown up and quantified, i.e. those urban zones and zones eligible for development that are affected by floods.
With respect to the urban zones, we have assumed them to have present IV: Present Institutional Vulnerability (PIV), while the zones eligible for development are classified as having Future Institutional Vulnerability (FIV). In other words, PIV tells us the percentage of “urban” land in a zone currently having 100-year flooding, while FIV gives us the percentage of land “eligible for development” in a zone with 100-year flooding potential, or, what amounts to the same, we consider the area earmarked in the plan for urban growth which is affected by zones where there is flood risk (Figure 2). Here, assuming a limitation of information in this regard, even though we have treated both aspects as stable (e.g. Jongman et al., 2014, Pérez et al., 2015a), we understand that the areas with flood risk where current planning allows development of them exhibit FIV, given that there is no legal impediment to occupation of such risk areas even though we do not know the extent of intended land use.
The two rates above have been calculated for the municipalities which the area studied takes in, where the results are broken down at local, provincial and regional levels.
On the other hand, the results were combined in a new rate (Figure 3) called Evolution of Institutional Vulnerability (EIV), which allows us to calculate change in IV over time. We moreover assume that EIV shows institutional sensitivity to non-structural measures, since the higher its value, the greater will be the exposure arising from the number of building projects allowed in floodable zones.
Figure 2. Expressions used in calculating MFZ (Municipal Floodable Zone), PIV and FIV. The i denotes each of the municipalities studied.
Figure 3. Expressions used in calculating EIV.
In regional and provincial terms, Catalonia and Tarragona respectively are the region and province with the highest percentage of Municipal Floodable Zone (MFZ), i.e. natural hazardousness. On the other hand, Murcia region and Barcelona are the region and province with the smallest affected area (Table 4 Panel A). Obviously this all depends on a random river system distribution that is also uneven in terms of the size of its catchment areas. Nonetheless and except for the great rivers that run through the municipalities of the area in our study (the Ebro, Júcar and Segura) and which seem to be the areas that have traditionally been most respected as regards occupation of them, generally speaking it is temporary watercourses that predominate, of the rain channel kind with steep slopes and short in length, and which drain quickly and cause flash floods every time when there are bouts of heavy downpours per hour that are a feature of the Mediterranean climate.
This is reflected on a local scale. Floods and zones at risk of flooding show themselves to be such a common phenomenon (Llasat et al., 2010) that only 26 municipalities (19.12 %) of the 136 studied do not present floodable zones, most of these being located in Barcelona Province. This could be interpreted as meaning that such places are away from danger, but after checking on the route charted by several watercourses we have seen that some of them still have not been modelled, which means that in this province the real MFZ values could be even higher than those shown on the maps and considered in this study. The other municipalities in the study area have a far from negligible average MFZ of 16.75 % (s.d. = 22.12, median = 6.10) which gives us some idea of the dense drainage system that covers this geographical area.
With respect to PIV, Catalonia and its three coastal provinces show the highest percentages. At the other end of the scale, Murcia region presents the lowest PIV levels (Table 4 Panel B). Furthermore, considering all of the percentages at municipal level, Catalonia is the region with the highest PIV(3). The findings mentioned reveal a clear construction slope from north to south which is broadly speaking attributable to a much earlier and more advanced degree of urban development in Catalonia than in the other two regions. This has led to a pattern of occupation and use of zones with flood risk that is far more biased toward zones that have become urban, these having largely been brought about by the residential tourism and demographic growth of a city of European significance such as Barcelona (Morris and Dickinson, 1987). In this respect the municipality of Barcelona stands out as having the highest PIV, since 100% of its area at risk from flooding is developed.
On the other hand, and as regards those efficient municipalities that have managed to restrict or limit building work in MFZs, only 10 have been counted, seven of which belong to the Valencian Community. Here we should point out the great efforts on the part of the regional government in drawing up and implementing an integrated plan to combat river surges and flooding (PATRICOVA), which, while not achieving maximum efficiency, seems to be starting to enjoy a certain degree of success (Olcina, 2010b). The other municipalities in the area in this study show a mean PIV of 21.02% (s.d. = 23.28, median = 12.55), which reflects a serious current problem that affects a substantial portion of developed area where most solutions involve a policy of drastic and expensive structural action.
With respect to FIV, the situation appears to be reversed in relation to everything mentioned thusfar. In this case Murcia region has the highest FIV, followed by the Valencian Community, and in last place we find Catalonia. The urban development experienced in the latter has been slowed down through having used up a large portion of the developed land over the time in which Valencia and Murcia lagged further behind. These two have tried to minimise this disadvantage via two strategies. The first was to apply a liberal policy with regard to the land included under the Land Law of 1998 and certain regional and municipal planning laws (Jiménez, 2009). The upshot of this legal context was an increase in the provision of land eligible for development in connection with zones at risk of flooding in most municipalities in the area which this study concerns. Thus, only 14 municipalities (12.73%) of the 110 municipalities with MFZs do not present FIV, and as regards the others there is a mean FIV reading of 15.61% (s.d.= 17.03, median = 9.52). It is the case that in certain municipalities in the area studied here (for example Torreblanca in Castellón) developing land so as to equip it with services has virtually used up this resource, and what is worse still, this increase has mostly occurred (92.97%) at the expense of the MFZ. Secondly, there is the housing demand for residences for European immigrants, which was on the rise in the area studied here, against a backdrop of economic boom in Europe over that time. This is a population segment that was attracted by the mild winter weather conditions on the Mediterranean coast and, in particular because of the advantageous economic situation with low mortgage interest rates in Spain (the rate fell from 16.6% in December 1990 to 4.2% in mid 2006, marking a low of 3.19% in August 2005), and that arrived in this territory en masse to buy up second homes.
Table 4. Percentage of MFZs, PIV and FIV in the study area at regional and provincial level.
Study area
%MFZ
(100=S.A.)
Region
%MFZ (100=Reg.)
Province
%MFZ (100=Prov.)
%MFZ (100=S.A.)
A
Municipalities on Spain’s Mediterranean coast
10,82
Catalonia
17,32
Barcelona
Girona
Tarragona
33,35
12,69
27,02
1,77
9,40
30,09
Valencian Community
11,55
Alicante
Castellón
Valen
7,46
7,88
25,88
13,62
7,98
20,20
Murcia Region
5,23
Murcia
5,23
16,94
Study area
%PIV
(100=S.A.)
Region
%PIV (100=Reg.)
Province
%PIV (100=Prov.)
%PIV (100=S.A.)
B
Municipalities on Spain’s Mediterranean coast
6,16
Catalonia
1,18
Barcelona
Girona
Tarragona
1,01
1,61
0,97
8,63
19,39
17,48
Valencian Community
0,74
Alicante
Castellón
Valencia
0,63
0,85
0,86
18,64
14,03
10,95
Murcia Region
0,21
Murcia
0,21
10,87
Study area
%FIV
(100=S.A.)
Region
%FIV (100=Reg.)
Province
%FIV (100=Prov.)
%FIV (100=S.A.)
C
Municipalities on Spain’s Mediterranean coast
15,95
Catalonia
1,54
Barcelona
Girona
Tarragona
1,30
2,03
1,34
4,30
9,43
9,34
Valencian Community
1,78
Alicante
Castellón
Valencia
1,10
2,23
2,76
12,63
14,18
13,50
Murcia Region
1,80
Murcia
1,80
36,61
*% MFZ: percentage of area at risk of flooding relative to the area of the coastal municipalities in the study area (S.A.) for the region (Reg.) or province (Prov.).
% PIV: percentage of urban area at risk of flooding relative to the area of the coastal municipalities in the study area (S.A.) for the region (Reg.) or province (Prov.).
% FIV: percentage of area eligible for development at risk of flooding relative to the area of the coastal municipalities in the study area (S.A.) for the region (Reg.) or province (Prov.).
Panel A shows the total area at risk of flooding broken down and with reference to different administrative levels.
Panel B shows the total urban area at risk of flooding broken down and with reference to different administrative levels.
Panel C shows the total area eligible for development at risk of flooding broken down and with reference to different administrative levels.
3.1.1. Evolution of Institutional Vulnerability (EIV)
In view of the change in PIV relative to FIV, i.e. the EIV, the built-up area in a zone at risk of floods will be substantially (4) higher than that registered at the moment. In this respect, for the study area as a whole institutional vulnerability will increase as there are increasingly more municipalities with a greater built-up area in zones at risk of flooding.
This situation takes on special importance in the case of Murcia Region, where the FIV can be 850% higher than the PIV (Table 5). At some distance behind it, it is followed by the Valencian Community and, in last place, Catalonia. In the latter and its provinces, the rise in FIV has not been so pronounced as in the rest of the regions. This could even be interpreted as proper incorporation of risk management measures by Catalonia in planning and minimisation of processes of occupation of zones at risk from flooding. Nevertheless, as has already been mentioned earlier and particularly in Catalonia, a large swathe of the urban land has used up the MFZ, for which reason its EIV rate is low relative to the other two autonomous regions.
Table 5. Change between PIV and FIV in the study area (S.A.) on a regional and provincial level.
Study area
% EIV (100 = S.A.)
Region
% EIV (100 = Reg.)
Province
% EIV (100 = Prov.)
% EIV (100 = S.A.)
Mediterranean Coast
258,99
Catalonia
131,35
Barcelona
129,14
49,86
Girona
125,93
48,62
Tarragona
138,45
53,46
Valencian Community
239,30
Alicante
175,43
67,74
Castellón
261,77
101,07
Valencia
319,21
123,25
Murcia Region
872,40
Murcia
872,40
336,84
*% EIV, indicates the percentage change in FIV relative to PIV in the study area (S.A.), the region (Reg.) and the province (Prov.).
In spite of the uneven increase in the EIV in each region, if the data is examined at municipal level, in all three of them there is a significant increase in it (according to the Wilcoxon signed rank test and the comparative t-test, p-value>0.05). In spatial terms, this situation is throwing up worrying figures, as, according to the mean urban growth rate for zones at risk of flooding in the study area which was estimated at 8.9%/year (Pérez et al., 2015a), as well as the percentage of land earmarked for public use (2008 Land Law, from 24% to 33% of residential land), in less than 20 years the exposed built-up area will have increased by over 50%, which amount could double in under 40 years.
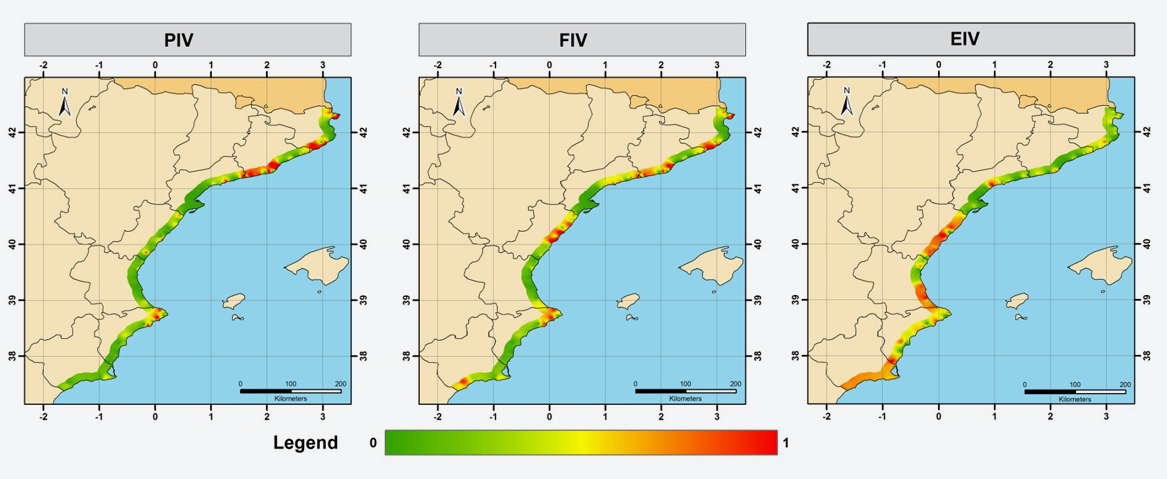
Figure 4. Present Institutional Vulnerability (PIV), Future Institutional Vulnerability (FIV) and Evolution of Institutional Vulnerability (EIV) in the study area. Due to the high values recorded for EIV, this has been shown using a log scale.
Finally, figure 4 spatially draws together all the results mentioned up to now via a density or weighted heat map featuring the values of each rate. To improve the graphic presentation of the map, at municipal level the study area has been homogenised spatially by extending them inland by some 10km. Broadly speaking, we can observe some high or very high FIV values in Catalonia which appear to sequentially increase towards the south on the coastlines of the provinces of Castellón, Alicante and Murcia. Looking at the EIV picture, contrary to what occurs in the Catalonian provinces where occasional spots appear of increased EIV due to the high PIV level (50% of Catalonian municipalities average a PIV of 55%), the other provinces show a pronounced increase in this rate. This situation becomes particularly significant in the provinces of Murcia and Castellón, where, despite the low PIV, the FIV values send the figure for the affected area shooting up. In these provinces, contrary to the case in the province of Valencia, anti-flood plans have had a minimal effect (Olcina, 2010b; Pérez et al., 2015b).
3.2. Increase in institutional vulnerability exposure
A more precise way to check on the shortcomings and failure to implement zoning and planning mechanisms to limit the occupation of zones at risk from flooding is by combining the water surface layers for each return period and the information from the Land Registry (MHAP, 2014). Using methodologies such as that followed in Pérez et al. (2015a) it is possible to run a high resolution space-time analysis and identify those plots of development or rural land which are in a zone at risk from flooding and even to quantify how they evolve and divide into periods based on a set of characteristics such as the year of construction of each of them.
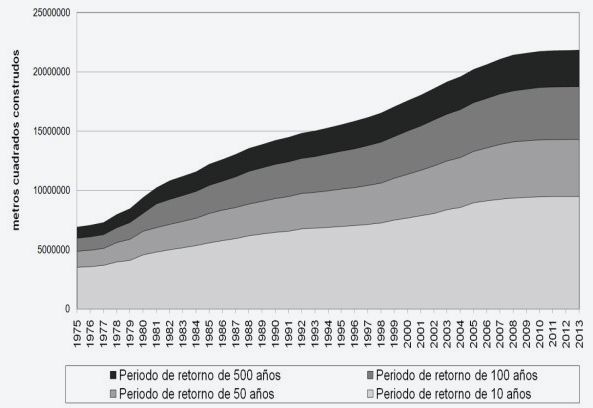
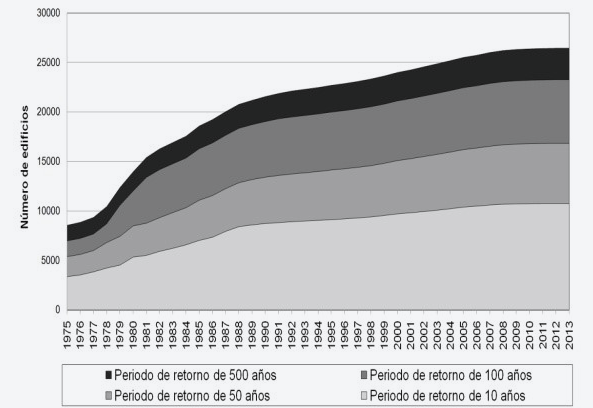
From applying the above in the geographical area of the municipalities on the coast in the provinces of Alicante and Murcia findings were obtained as follows: according to Figures 5a and b, from 1975 the developed area and the number of buildings which occupy each of the floodable zones for the return periods studied (10, 50, 100 and 500 years) have experienced continued cumulative growth on the coastline of the provinces of Murcia and Alicante.
In relative figures, the results are truly alarming. For the study period the increase in urban plots is 347% ( 1975=100), which represents an annual growth rate of 8.9%. Yet what is striking is that the growth of urban plots in areas prone to flooding has been greater than that in areas not at risk from flooding (273%). With respect to the area occupied by buildings on exposed land, the growth figures are noticeably lower (368%) relative to what has happened in non-exposed areas (442%). Whatever the case, these are still very high figures which give an idea of the accelerated process of development expansion and the low impact which flood risk mitigation regulation via territorial planning measures has had.
Figura 5 a: Saturation curve of the built-up area in a zone at
risk of floods for different return periods.
Source: Own research.
Figura 5 b: Saturation curve of buildings erected in a zone at
risk of floods for different return periods.
Source: Own research.
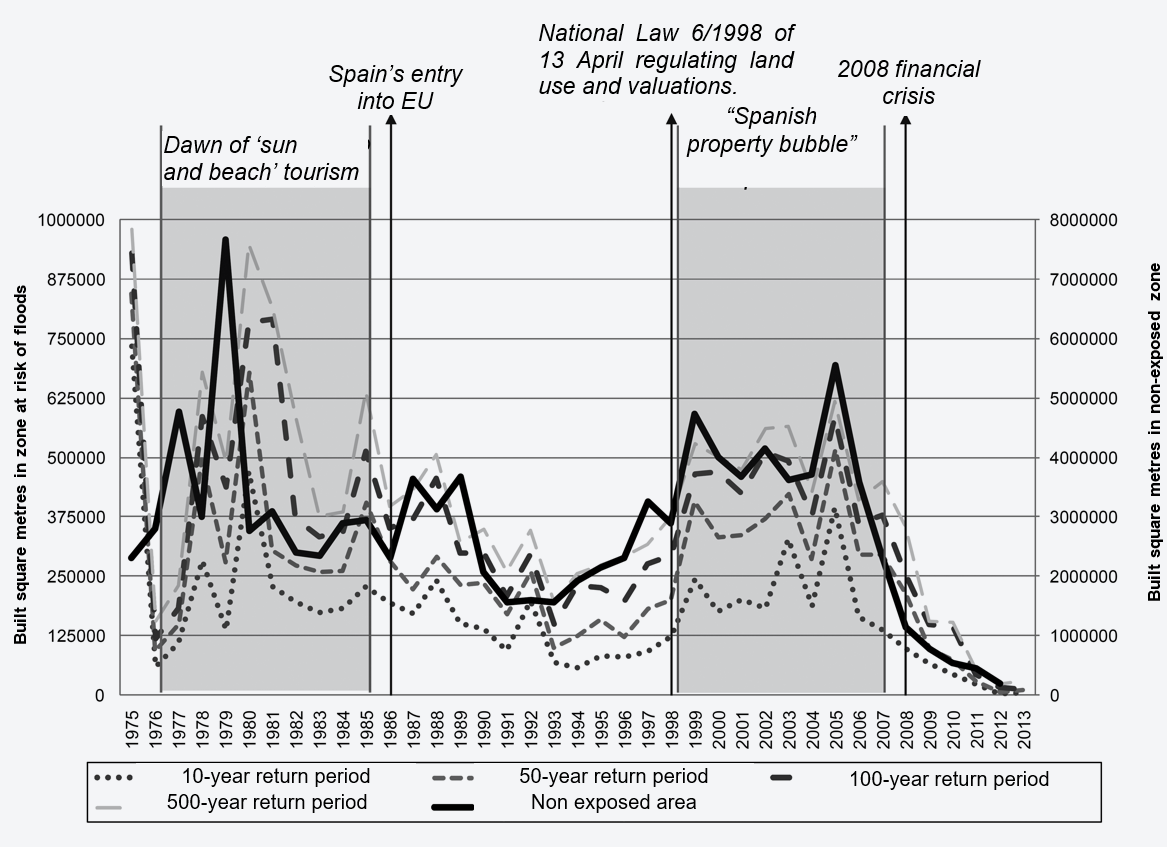
The in-depth analysis in Figure 6 allows us to make out two clearly differentiated periods, 1975-1993 and 1994-2013. The first was preceded by the first oil crisis in 1973. Despite the powerful impact that this event made, which, in general terms, led to the stagnation of the Spanish economy for a whole decade, within our study area its effects on real estate activity were short-lived as a result of the housing needs of a growing population in combination with the growth in living quarters for a tourist sector that was steadily on the rise. Thus, from 1977 urban growth surged in areas either at risk or not at risk from flooding. The main reasons behind this new dynamic are to be found in the changes which the oil crisis brought about to the Spanish economic model, with the economy’s gradual shift into the services sector coupled with the increasing significance of state GDP within that particular sector (Prados de la Escosura and Sanz, 1996). This process was especially influential in the more tourism-oriented regions and municipalities such as those in the study area since, together with Spain’s entry into the European Union in 1986, it exerted a strong pull on the population segment that was drawn to the momentum experienced by such activities (Harrison, 2006), among these principally tourism, which eventually gave rise to an increase in building construction to cater for the arrival of workers and visitors. Between 1975 and 1980 a total of 35,618 new buildings were put up in the study area, of which 6,361 (or 17.8%) were erected in a zone at risk of flooding (Figure 3), which represents an average rate of occupation of areas at risk of floods (the speed at which floodable area becomes saturated) of 0.61% a year across all of the exposed zones and a high 1.9% for the ten-year return period (see Figures 4 a and b) at what was the most intensive moment of occupation of space at risk of floods throughout the entire series analysed.
Figure 6. Evolution of developed area in the zone at risk from flooding for the various different return periods.
Source: Own research.
From 1980, as can be noted from Figures 5 a and b, the development rate declined to 0.1% in 1993 for the average for all return periods. This year marked the start of another major economic crisis (Prados de la Escosura and Sanz, 1996) and brought the first period to a close, which, even so, had begun to show signs of flagging in the mid 80s of the 20th century. Aside from economic factors, this change could have owed itself to the implementation of the first effective risk mitigation measures by the municipalities on the Spanish coast. These structural actions were undertaken as a response to social demand for solutions to the problem of repeated episodes of flooding that took place in the 80s on the Mediterranean coastline (Serra-Llobet et al., 2013). These prompted the Protection Plan against river surges in the Segura basin and construction work on minor water-courses (gullies and rain overspill channels) that were carried out in several municipalities on the Murcia and Alicante coastline.
Nevertheless, the general net outcome of this initial period translated into an increase in the developed area in floodable zones of 9,087,743 m², which, added to what had already been built, lifted the figure to 15,024,205 m². On the other hand, the number of buildings put up was the highest for the period studied. A total of 90,922 buildings were erected, of which 14,692 were in catchment areas for the various different return periods. At the time, the availability of a lot of land that could be used for construction provoked a fragmented urban growth model around a host of focal points that was more extensive in horizontal rather than in vertical terms, unlike what happened in the second "development boom" identified (Figures 5 a and b).
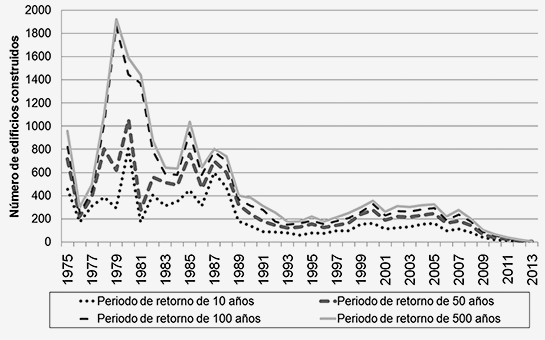
Fig. 7 a: Trends in the number of buildings put up in zones at risk from floods for the various different return periods.
Source: Own research.
Fig. 7 b: Trends in the percentage of developed area in zones at risk from floods for the various different return periods.
Source: Own research.
The overcoming of the economic crisis that affected Spain in 1993 and gave rise to a sharp decrease in real estate activity marked the start of the second growth period for the stock of housing, which was the one that ended up saturating the area at risk of flooding in several municipalities studied. This new upturn began between 1994 and 1997, although it was above all from 1998 when another unbridled process of construction was unleashed which, far from respecting the boundary of natural watercourses, again contributed to the increase and accumulation of both buildings and occupied area in zones at risk of flooding as gauged by different return periods. In the 1998-2006 period alone, some 2,644 new buildings went up, with an annual rate of building activity in zones at risk of flooding showing levels more akin to those in the previous housing boom and which meant that Spain now led the way in Europe in this regard (Burriel, 2008).
Notable among the causes that help comprehend the scale of this phenomenon is the liberalisation itself of the development process that was experienced with the state passing of the Land Law and the arrival en masse of new central European residents that was mentioned in the previous section. This situation has caused land development for incorporating urban services in certain municipalities in the study area (e.g. Torrevieja) to virtually use up this resource within the space of barely 15 years. By way of a general assessment of the whole situation, this period was responsible for an increase of 6,813,211 m² of built up area in floodable zones, which, together with what had already been accumulated, gives us an overall figure of 21,837,416 m². This has prompted saturation of the space at risk of floods which has given rise to differences in development patterns, given that over the recent development boom the number of buildings put up in floodable zones was far smaller (4,148 between 1994 and 2013, compared to 14,692 for the 1975-1993 period), which indicates a shift in the urban development model towards settlement taking place in the form of large ownerships associated with a single building (Table 2).
Table 6. Summary table showing total area and the number of buildings erected in zones exposed to different return periods.
Years
Area (Hectares)
No. of properties
10-year return period
50 year return period
100 year return period
500 year return period
Area (Hectares)
No. of properties
Area (Hectares)
No. of properties
Area (Hectares)
No. of properties
Area (Hectares)
No. of properties
1975
390.863
69.943
27.926
2.942
40.350
4.697
50.555
6.187
59.365
7.617
1975-1993
699.145
90.922
40.511
6.079
58.226
9.169
78.220
13.466
90.877
14.692
1994-2013
592.785
35.946
26.676
1.772
44.676
2.966
59.008
3.611
68.132
4.148
Total
1.682.792
196.811
95.113
10.793
143.252
16.832
187.784
23.264
218.374
26.457
Source: Own research based on information from the urban land registry.
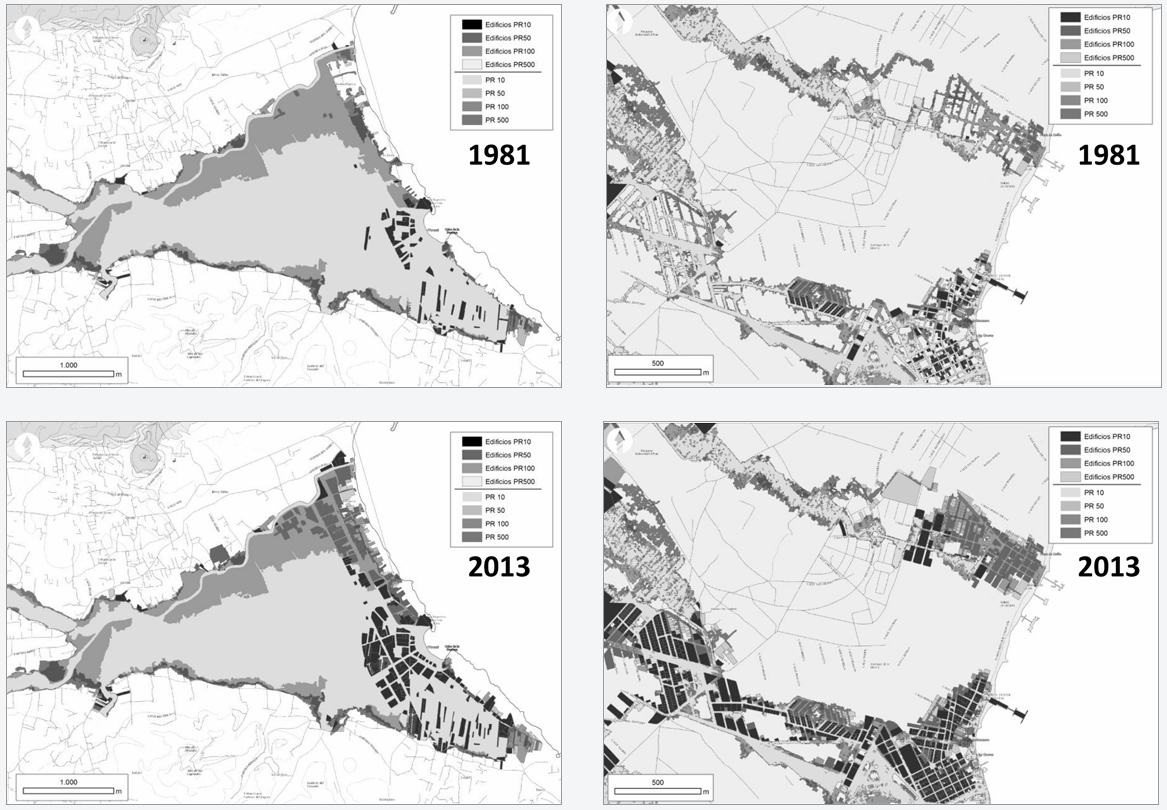
The result of this process of expansion of housing over the 39 years in the data series reviewed here has translated into the progressive integration of river courses into the urban street plan and therefore a steady increase in exposure to flood hazard (Figure 8).
Figure 8. Increase in the exposure of two selected population centres from the study area between 1981 and 2013. To the left, Jávea (Alicante), and to the right, San Javier (Murcia).
Source: Own research.
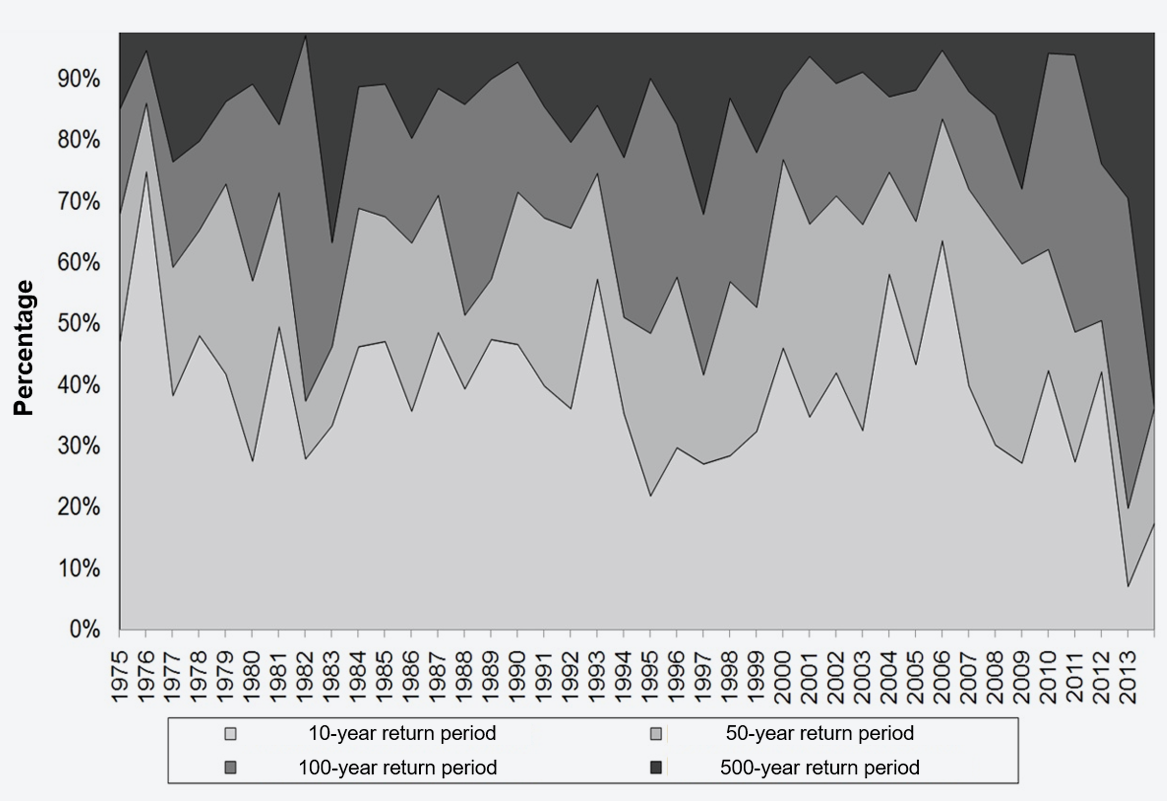
This is noticeable in the distribution of what was built in the various different return periods with respect to the overall figure. Figure 9 shows that up to these past few years occupation of areas at risk of flooding has mainly taken place in the 10-year zone. This is an alarming piece of information which has arisen from a common trend in a geographical area where the river system mostly comprises rain overspill channels and gullies which naturally stay dry for long stretches of time and only cease to be so in temporary situations after rainfalls with heavy hourly rates, so this contributes to a minimal perception of any hazard of flooding (Llasat et al, 2008). Unfortunately these physical features have always tempted people to occupy the fringes closest to flood plains and when they do not do this, to install buildings directly in the bottom of such river channels and to completely blur the original route which they take (Pérez, 2008).
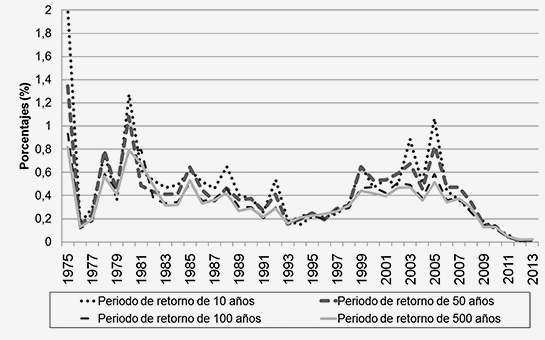
Figure 9. Evolution of the percentage built in each return period.
Source: Own research.
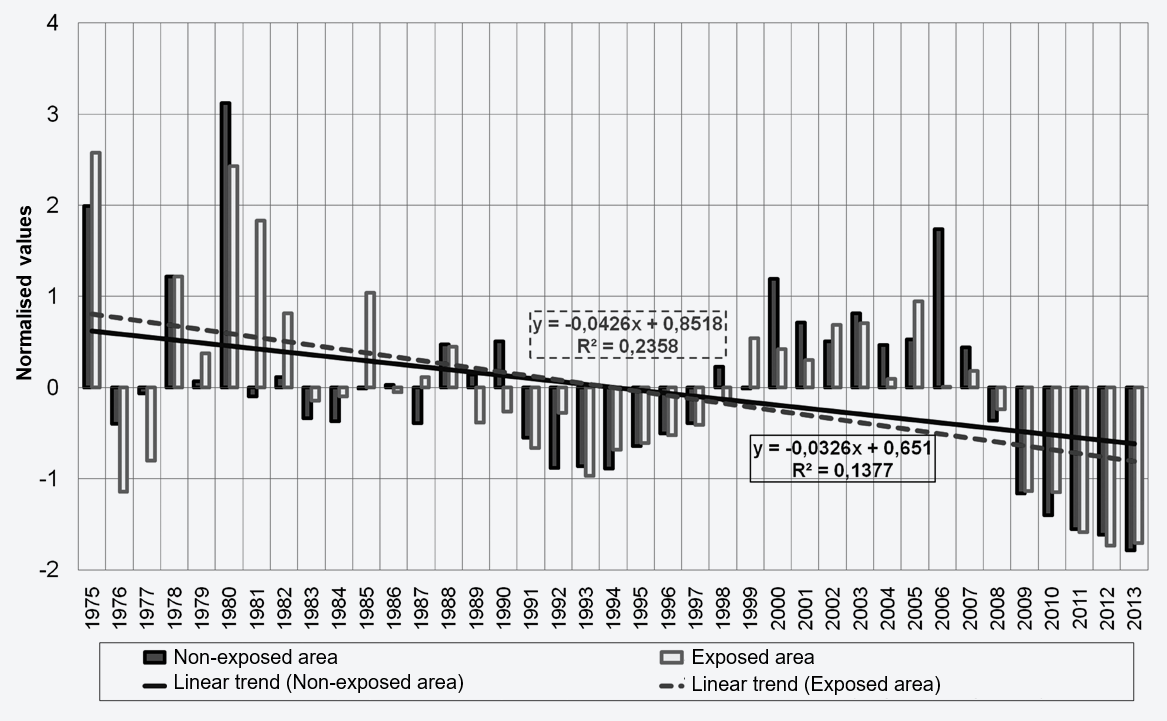
Figure 10 shows the trend taken by built-up area in zones at risk of flooding with respect to the overall figure built. There is an observable level of variability which fits in with the moments of crisis and growth described. Nonetheless the trend line for exposed area shows a somewhat steeper downward slope than for the non-exposed area. This fact likely relates to the flurry of occupation of risky areas which we have mentioned in previous decades (1970 to 1990) with respect to the last surging phase in real estate activity and to the possible impact of legal restrictions on occupying risky areas (the Land Laws of 1998 and 2008, and regional territorial zoning plans). Whatever the case, the data is not entirely conclusive and the difference is not statistically significant (Mann-Whitney u-test, p-value>0.05).
Figure 10. Evolution of normalised developed area in exposed and non-exposed zones.
Source: Own research.
The increase in episodes of heavy rainfall with a high hourly rate emerges as one of the indicators of climate change within the Mediterranean climatic area. Over the past two decades localities along Spain’s Mediterranean coastline have found themselves embroiled in them and have suffered serious floods involving substantial economic losses and even human victims on days when there have been downpours with high hourly rates which the natural and artificial drainage systems have not managed to cope with, leading to major waterlogging.
In Spain strategies are beginning to be developed for adapting to both climate change and associated atmospheric extremes, which include structural measures (sustainable drainage construction projects, and actions in connection with energy and water supply) and non-structural ones (territorial planning). Worth noting in this context are Barcelona, Málaga, Alicante, Reus, Calviá and several municipalities in the Basque Country, where municipal by-laws have been passed that are linked to reducing the effects of climate change. Yet there is still a lot left to do.
The atmospheric extremes of the Mediterranean climate pose a challenge for the urban water cycle. Mediterranean cities have to be prepared to put up with months of hardly any rain and, on the other hand, to withstand torrential rains that cause waterlogging and flooding. Water and territorial planning “for extremes” is required that can guarantee water within a geographical area that is subjected to bouts of drought and has significant urban demand. And which likewise avoids the loss of human life and origination of high economic losses as a result of very heavy rainfalls within only a short space of time.
The accompanying table offers a summary of the challenges posed by water for urban planning on the Mediterranean coast as these relate to the foreseeable rise in bouts of heavy downpours with greater hourly rates which climate modelling estimates.
Table 7. Adaptation strategies to flooding caused by rainfalls with heavy hourly rates on Spain’s Mediterranean coast.
Planning for episodes of torrential rain
- Building high capacity rainwater collectors
- Adapting traditional drainage and sewerage systems to heavy rainfalls
- Building rain reservoirs
- Building floodable public areas (parks and concourses)
- Warning systems for population centres (special Apps on mobiles)
Own research.
With respect to action of a non-structural or preventive nature, the various arms of government seem to have taken significant initial steps since approval was given for European Commission Directive 2007/60/EC and its transposition to Spanish law in 2010. In the past five years these tasks have seen substantial improvement in the form of more available information on zones at risk of flooding and a better defined organisation chart of responsibilities which are taking shape in the first flood risk management plans (FRMPs). The mission of these (which is by no means straightforward) is to achieve coordinated action by all of the public administrative bodies and society, thereby reducing the adverse effects of floods. One of the forms of action that has been taken of late to smooth implementation of these plans is publication of a guide on reducing building vulnerability by the Consorcio de Compensación de Seguros (Consorcio de Compensación de Seguros, 2017). The central purpose of this is to help understand the cause and effect of problems brought about by flooding in a building or premises and to offer guidance on how to minimise damage. Consistent with these aims, the benefits and usefulness it provides with respect to the issue of risk management are key to achieving only a minimum of loss in connection with everything that has been set out in this paper.
Aledo Tur, A.; Mazón Martínez, T.; Mantecón Terán, A. 2007. "La insostenibilidad del turismo residencial". En: Antropología y turismo : claves culturales y disciplinares / David Lagunas (coord.). México, D.F.: Plaza y Valdés, 2007. ISBN 978-970-722-626-5, pp. 185-208
Barredo, J. I., 2007. Major flood disasters in Europe: 1950–2005. Natural Hazards, 42, 125-148. DOI: 10.1007/s11069-006-9065-2
Birkmann, J., 2013. Measuring vulnerability to natural hazards: towards disaster resilient societies (No. 363.34 M484m). New York, US: United Nations University Press.
Burby, R. J., 2006. Hurricane Katrina and the paradoxes of government disaster policy: Bringing about wise governmental decisions for hazardous areas. The Annals of the American Academy of Political and Social Science, 604(1), 171-191. DOI: 10.1177/0002716205284676
Burriel, E., 2008. La década prodigiosa del urbanismo español (1997-2006). Scripta Nova, 12 (270), 64.
Calvo García-Tornel, F., 1997. Algunas cuestiones sobre geografía de los riesgos. Scripta Nova: Revista Electrónica de Geografía y Ciencias Sociales, Universidad de Barcelona, 10.
Calvo García-Tornel, F., 2001. Sociedades y Territorios en Riesgo. Ediciones Serbal, Barcelona.
Cardona O.D., van Aalst M.K, 2012. Determinants of risk: exposure and vulnerability, in: C.B. Field et al., (Eds.), Managing the risks of extreme events and disasters to advance climate change adaptation. A special report of working groups I and II of the intergovernmental panel on climate change (IPCC). Cambridge University Press, Cambridge, pp. 65-108.
CEDEX (2012) Estudio de los impactos del cambio climático en los recursos hídricos y en las masas de agua. Informe Técnico para el Ministerio de Agricultura, Alimentación y Medio Ambiente. Centro de Estudios Hidrográficos. Informe Final. Madrid, 46 p.
Consorcio de Compensación de Seguros (2017) Guía para la reducción de la vulnerabilidad de los edificios frente a las inundaciones. Madrid, 103 p. Disponible en: http://www.consorseguros.es/web/documents/10184/48069/guia_inundaciones_completa_22jun.pdf/480edc31-446b-40a5-af5b-2c37daf20a35
Cutter, S. L., Boruff, B. J., Shirley, W. L., 2003. Social vulnerability to environmental hazards. Social science quarterly, 84(2), 242-261. DOI: 10.1111/1540-6237.8402002
Directive 2007/60/EC of the European Parliament and of the Council of 23 October 2007 on the assessment and management of flood risks.
EIRD, 2005. Marco de acción de Hyogo 2005-2015. Ginebra: Secretaría de la Estrategia Internacional de la ONU para la Reducción de los Desastres. [consulta 29 de julio de 2014]
Fuchs, S., Keiler, M., Zischg, A., 2015. A spatiotemporal multi-hazard exposure assessment based on property data. Natural Hazards and Earth System Sciences, 15(9), 2127-2142. DOI: 10.5194/nhess-15-2127-2015
Fuchs, S., Röthlisberger, V., Thaler, T., Zischg, A., Keiler, M., 2017.Natural hazard management from a co-evolutionary perspective: exposure and policy response in the European Alps. Annals of the American Association of Geographers, 107(2), 382-392. DOI: 10.1080/24694452.2016.1235494
Giddens, A., 2002. Modernidade e identidade. Zahar.
Gil-Guirado, S., Pérez-Morales, A., López-Martínez, F., Barriendos-Vallvé, M., 2016. Are we safe? A tool to improve the knowledge of the risk areas: high-resolution floods database (MEDIFLOOD) for Spanish Mediterranean coast (1960-2014). In EGU General Assembly Conference Abstracts (Vol. 18, p. 4218).
Gonzalez Herrero, S y Bech, J. (2017) “Extreme point rainfall temporal scaling: a long term (1805-2014) regional and seasonal analysis in Spain: extreme point rainfall temporal scaling in Spain”, International Journal of Climatology. doi: 10.1002/joc.5144
Harrison, J., 2006. Economic crisis and democratic consolidation in Spain, 1973-82. Working Papers in Economic History, 06-10, 1-33.
Iglesias, F., 2007. Urbanismo y democracia. Alternativas para evitar la corrupción. Fundación Alternativas.
IPPC, 2012. Managing the risks of extreme events and disasters to advance climate change adaptation. Intergovernmental Panel on Climate Change – IPPC. Cambridge.
IPCC, 2014.Climate Change 2014: Synthesis Report. Contribution of Working Groups I, II and III to the Fifth Assessment Report of the Intergovernmental Panel on Climate Change [Core Writing Team, R.K. Pachauri and L.A. Meyer (eds.)]. IPCC, Geneva, Switzerland, 151 pp.
Jiménez, F. (2009) Building boom and political corruption in Spain. South European Society and Politics, 14 (3), 255-272.
Jongman, B., Koks, E. E., Husby, T. G., Ward, P. J., 2014. Increasing flood exposure in the Netherlands: implications for risk financing. Natural Hazards and Earth System Sciences, 14(5), 1245-1255. DOI: 10.5194/nhess-14-1245-2014
Lane, S. N., Odoni, N., Landström, C., Whatmore, S. J., Ward, N., & Bradley, S., 2011. Doing flood risk science differently: an experiment in radical scientific method. Transactions of the Institute of British Geographers, 36(1), 15-36.
Lebel, L., Manuta, J. B., Garden, P., 2011. Institutional traps and vulnerability to changes in climate and flood regimes in Thailand. Regional Environmental Change, 11(1), 45-58. DOI: 10.1007/s10113-010-0118-4
Llasat, M. C., Llasat-Botija, M., Prat, M. A., et al., 2010. High-impact floods and flash floods in Mediterranean countries: the FLASH preliminary database. Advances in Geosciences, 23, 47-55. DOI: 10.5194/adgeo-23-47-2010
Llasat, M. C., López, L., Barnolas, M., y Llasat-Botija, M. (2008). Flash-floods in Catalonia: the social perception in a context of changing vulnerability, Adv. Geosci., 17, 63-70, doi:10.5194/adgeo-17-63.
López-Martínez, F., Gil-Guirado, S., & Pérez-Morales, A., 2017. Who can you trust? Implications of institutional vulnerability in flood exposure along the Spanish Mediterranean coast. Environmental Science & Policy, 76, 29-39.
Marchi, L., Borga, M., Preciso, E., Gaume, E., 2010. Characterisation of selected extreme flash floods in Europe and implications for flood risk management. Journal of Hydrology, 394, 118-133. DOI: 10.1016/j.jhydrol.2010.07.017
Marcos-García, P. y Pulido-Velázquez, M (2017) “Cambio climático y planificación hidrológica: ¿Es adecuado asumir un porcentaje único de reducción de aportaciones para toda la demarcación?”, Ingeniería del Agua, 21,1, 35-52.
MHAP. (08 de 08 de 2014). Dirección General del Catastro. Recuperado el 08 de 05 de 2014, de Dirección General del Catastro: http://www.sedecatastro.gob.es/
Morris, A., y Dickinson, G., 1987. Tourist development in Spain: growth versus conservation on the Costa Brava. Geography, 16-25
Olcina Cantos, J., 2010a. El tratamiento de los riesgos naturales en la planificación territorial de escala regional. Papeles de Geografía, 51-52, 223-234.
Olcina Cantos, J., 2010b. Spatial planning processes, territorial planning law and flood risk in the region of Valencia (Spain). Risks Challenging Publics, Scientists and Governments, 191.
Parker, D., Tapsell, S. et al., 2009. Deliverable 2.1. Relations between different types of social and economic vulnerability. Final draft report submitted to EU project Enhancing resilience of communities and territories facing natural and na-tech hazards (ENSURE).
Pérez-Morales, A., 2008. Aumento del riesgo de inundación por ocupación indebida de las áreas de convergencia de aguas en el Sur de la Región de Murcia. Scripta Nova: revista electrónica de geografía y ciencias sociales, 12.
Pérez-Morales, A., Gil-Guirado, S., Olcina, J., 2015a. Housing bubbles and increase of the exposure to floods. Failures in the floods management in the Spanish coast. Journal of Flood Risk Management. DOI: 10.1111/jfr3.12207
Pérez-Morales, A., Gil-Guirado, S., Martín, F., 2015b. Veinte años de protección de cauces en el litoral de la Región de Murcia (1194-2014). Evaluación de la eficiencia de las medidas de Ordenación del Territorio. Anales de geografía de la Universidad Complutense, 35, 169-185.
Prados De la Escosura, L. y Sanz, J. C., 1996. Growth and macroeconomic performance in Spain, 1939-93., En: Economic Growth in Europe since 1945, Crafts, N. y Toniolo, G. (eds.), 355-387. Cambridge University Press, Cambridge.
Raschky, P. A., 2008. Institutions and the losses from natural disasters. Natural Hazards and Earth System Sciences, 8(4), 627-634. DOI: 10.5194/nhess-8-627-2008
Renn, O., 2008. Risk governance: coping with uncertainty in a complex world. Earthscan.
Serra-Llobet, A., Tàbara, J.D. y Saurí, D., 2013. The Tous dam disaster of 1982 and the origins of integrated flood risk management in Spain. Natural hazards, 65 (3), 1981-1998.
Serrano Notivoli, R. (2017) Reconstrucción climática instrumental de la precipitación diaria en España: ensayo metodológico y aplicaciones. Tesis doctoral, inédita. Universidad de Zaragoza. Facultad de Filosofía y Letras. Departamento de Geografía y Ordenación del Territorio. Zaragoza, 234 pp + anexo cartográfico.
Smith K., Petley, D. N., 2009. Environmental Hazards: Assessing Risk and Reducing Disaster. Routledge.
Tate, E., 2013. Uncertainty analysis for a social vulnerability index. Annals of the association of American geographers, 103(3), 526-543.
Wilches-Chaux, G., 1993. La vulnerabilidad global, in: Maskrey, A. (Ed.), Los desastres no son naturales. LA RED, Colombia, pp. 9 - 50.
Wisner, B., 2000. From “Acts of God” to “Water Wars”: The urgent analytical and policy role of political ecology in mitigating losses from flood: A view of South Africa from Central America, in: Parker, D. J., (Ed.), Floods. Routlege, London and New York, pp. 88-99.
Wisner, B., Blaikie, P., Cannon, T., Davis, I., 2004. At risk. Natural hazards, people’s vulnerability, and disasters. Routledge, London and New York.
WTO, 2016. Tourism Highlights. United Nation World Tourism Organization.