This statistical study discusses the historical trend for the economic results obtained by the Consorcio de Compensación de Seguros (CCS) in its role as a Guarantee Fund for the Compulsory Motor car Third-Party Liability Insurance (MTPL) over the past 20 years (time series for 2001-2020).
Legislative framework
The following laws set up the legal framework for the above-mentioned insurance scheme and CCS's activity.
- Civil liability insurance for motor vehicles:
- Decreto 632/1968, de 21 de marzo, por el que se aprueba el texto refundido de la Ley 122/1962, de 24 de diciembre, sobre el uso y circulación de vehículos de motor [Spanish Decree 632/1968 of 21 March 1968 approving the Consolidated Text of Law 122/1962 of 24 December 1962 on use of motor vehicles], as subsequently amended, with its implementing regulations. In force until 5 November 2004.
- Real Decreto Legislativo 8/2004, de 29 de octubre, por el que se aprueba el texto refundido de la Ley sobre responsabilidad civil y seguro en la circulación de vehículos a motor [Spanish Royal Legislative Decree 8/2004 of 29 October 2004 approving the Consolidated Text of the Law on civil liability and insurance in respect of the use of motor vehicles], as subsequently amended, with its implementing regulations. In effect since 6 November 2004.
- Legal Statute of the CCS, framing the functions performed by the CCS with regard to Compulsory MTPL Insurance:
- Section 4 of Ley 21/1990, de 19 de diciembre, de adaptación del Derecho español a la Directiva 88/357/CEE, sobre libertad de servicios en seguros distintos al de vida, y de actualización de la legislación de seguros privados [Spanish Law 21/1990 of 19 December 1990 adapting Spanish Law to Directive 88/357/EEC, on freedom of non-life insurance services, and updating the legislation on private insurance], as subsequently amended. In force until 5 November 2004.
- Texto refundido aprobado por el Real Decreto Legislativo 7/2004, de 29 de octubre [Consolidated Text approved by Spanish Royal Legislative Decree 7/2004 of 29 October 2004], as subsequently amended. In effect since 6 November 2004.
CCS' insurance duties as the Guarantee Fund for compulsory Motor car Third-Party Liability insurance
The CCS' functions in its role as Guarantee Fund for Compulsory Motor car Third-Party Liability Insurance under the scope of and the territory covered by the compulsory insurance scheme are:
- To indemnify parties who have suffered personal injury caused by accidents that take place in Spain where the vehicle responsible is unidentified. Where there is significant personal injury, the CCS also indemnifies for property damage.
- To indemnify for personal injuries and property damage caused by a vehicle normally based in Spain where the vehicle responsible is uninsured.
- To indemnify for personal injuries and property damage caused in Spain where the vehicle responsible has been stolen.
- To indemnify for personal injuries and property damage where the Spanish insurer of the vehicle normally based in Spain has been declared insolvent by a court of law or is in court-ordered administration or liquidation or has been taken over by the CCS (insurers being wound up).
From the above we can see that the CCS, as the Guarantee Fund, has been assigned a broad range of tasks: as is to be expected, it performs the two functions required of Guarantee Funds in each EU Member State established by the Directive relating to insurance against civil liability in respect of the use of motor vehicles (compensating for damage caused by vehicles operated unlawfully without insurance and by unidentified or hit-and-run vehicles). In addition, it performs a third function, namely, paying compensation for damage caused by vehicles that have been stolen or obtained by violence, which Member States, under the Directive, may assign either to the insurer of the stolen vehicle or to the Guarantee Fund. And lastly, the CCS takes on a fourth function not envisaged in the Directive, namely, paying compensation for accidents caused by vehicles which are insured with a Spanish insurer that is insolvent or being wound up. It should be noted that at the time of this writing an amendment to the Directive is in preparation to address a series of issues, one being to include this fourth function and in that way complete the full panoply of safeguards for traffic accident victims.
The CCS obtains the financial wherewithal to be able to pay for the Guarantee Fund covers through the MTPL surcharge, calculated based on the commercial compulsory insurance premium. This surcharge is collected with the insurance premiums on all motor vehicles normally based in Spain.
Statistics on the Guarantee Fund for compulsory Motor car Third-Party Liability insurance
These statistics provide a picture of the CCS in its role as the Guarantee Fund for Compulsory MTPL Insurance in the period between 2001 and 2020.
Data are provided on risk exposure (portfolio and surcharges) and loss rates by type (uninsured, unidentified, and stolen vehicles and vehicles insured with insurers in the process of being wound up).
All monetary values have been expressed in current euros as of 31 December 2020. Surcharges and loss rates have been adjusted on the basis of the changes in the consumer price index (CPI) over the period considered, set out below in Table 1.
| Year |
% annual CPI variation |
Coefficient of accumulated variation (2020-12-31) |
| 2001 |
2.7 |
1.403374 |
| 2002 |
4.0 |
1.349398 |
| 2003 |
2.6 |
1.315203 |
| 2004 |
3.2 |
1.274421 |
| 2005 |
3.7 |
1.228950 |
| 2006 |
2.7 |
1.196641 |
| 2007 |
4.2 |
1.148408 |
| 2008 |
1.4 |
1.132552 |
| 2009 |
0.8 |
1.123564 |
| 2010 |
3.0 |
1.090838 |
| 2011 |
2.4 |
1.065272 |
| 2012 |
2.9 |
1.035250 |
| 2013 |
0.3 |
1.032153 |
| 2014 |
-1.0 |
1.042579 |
| 2015 |
0.0 |
1.042579 |
| 2016 |
1.6 |
1.026160 |
| 2017 |
1.1 |
1.014996 |
| 2018 |
1.2 |
1.002960 |
| 2019 |
0.8 |
0.995000 |
| 2020 |
-0.5 |
1.000000 |
Adjusted CPI percentage coefficient values.
These statistics on the Guarantee Fund for civil liability insurance for motor vehicles have been divided into three sections, "Risk Exposure", "Loss Rate", and "Summary and Results" (respectively, Sections 1, 2, and 3).
Risk exposure data
The risk exposure data refer to the number of insured vehicles and the CCS's revenues for its risk covers.
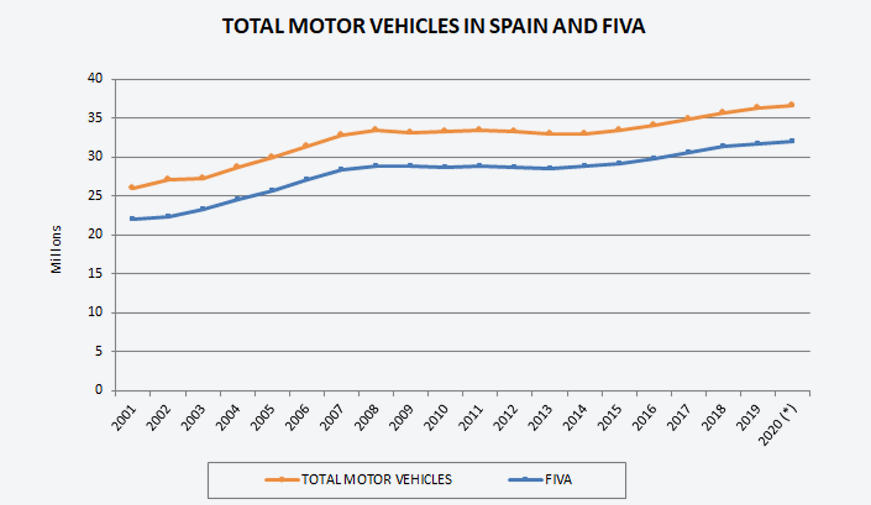
Insured vehicles
Since the number of vehicles exposed to risk under the Guarantee Fund is unknown, it is taken to be the total number of Spanish motor vehicles according to data from the
Dirección General de Tráfico [Directorate-General for Traffic]. Figures for the number of insured according to the
Fichero Informativo de Vehículos Asegurados [Insured Vehicle Information Database] (FIVA, according to its Spanish abbreviation) are also given.
Loss rate data
The loss rate data are for claims submitted and approved, either already processed or being processed.
The loss rates shown are through 31 May 2021.
The criteria for time distribution of the claims and their sums paid out and provisioned, is that of the year of occurrence of the loss, regardless of other circumstances such as the date of declaration, date of payout or termination date of the claim.
The data collected and used to compile these loss rate statistics were number of claims, compensation paid out, and mean costs. Indemnities were the total sums paid out or for which provisions have been allocated (i.e., for compensation, interest, and court costs) but not including expenses for property damage, claims adjusters, medical experts, lawyers' fees, or other costs). In addition, compensation paid out has not been set off against claims recovered by the Guarantee Fund.
The following information is provided for each type of insurance:
- Number of claims, indemnities paid out, and mean costs by year of occurrence.
- Maps showing the occurrence of losses by province.
- Indemnities paid out by year of occurrence and type of loss.
When considering the loss rate data, changes in compulsory insurance coverage limits should also be taken into account.
- The limits for losses that took place from 1 January 1996 to 12 February 2001, were as follows pursuant to Transitional Provision Twelve of Ley 30/1995, de 8 de noviembre, de Ordenación y Supervisión de los Seguros Privados [Spanish Law 30/1995 of 8 November 1995 on the Regulation and Supervision of Private Insurance]:
- Limit of 601.01 euros for medical/hospital attention at unapproved medical centres, no limit at approved centres.
- For personal injury: 336,566.78 euros per victim.
- For property damage: 96,161.94 euros per loss.
- The limits for losses that took place from 13 February 2001 to 31 December 2007 were as follows pursuant to Real Decreto 7/2001, de 12 de enero, por el que se aprueba el Reglamento sobre la responsabilidad civil y seguro en la circulación de vehículos de motor [Spanish Royal Decree 7/2001 of 12 January 2001 approving the Implementing Regulations to the Law on civil liability and insurance in respect of the use of motor vehicles]:
- For medical attention, pharmaceuticals, and hospital care: no limit.
- For personal injury: 350,000 euros per victim.
- For property damage: 100,000 euros per loss.
- The limits for losses that have taken place from 1 January 2008 to the present were and are as follows pursuant to Ley 21/2007, de 11 de julio, por la que se modifica el texto refundido de la Ley sobre responsabilidad civil y seguro en la circulación de vehículos a motor [Spanish Law 21/2007 of 11 July 2007 on civil liability and insurance in respect of the use of motor vehicles]:
- For medical attention, pharmaceuticals, and hospital care: no limit.
- For personal injury: 70,000,000 euros per loss.
- For property damage: 15,000,000 euros per loss.
Summary and results
This last section has three subsections presenting the trends for risk exposure, loss rates, and the results obtained.
Section 1: risk exposure statistics, time series for 2001-2020
1. Total motor vehicles and FIVA database
| Year |
Lorries and vans |
Coaches |
Cars |
Motorcycles |
Industrial tractors |
Trailers and semitrailers |
Other vehicles |
Mopeds |
Total motor vehicles
Mopeds included |
|
FIVA |
| |
| 2001 |
3,949.001 |
56,146 |
18,150,880 |
1,483,442 |
155,957 |
454,445 |
1,806,758 |
26,056,629 |
|
21,958,146 |
| 2002 |
4,091,875 |
56,953 |
18,732,632 |
1,517,208 |
167,014 |
287,220 |
212,830 |
2,044,242 |
27,109,974 |
|
22,408,462 |
| 2003 |
4,188,910 |
55,993 |
18,688,320 |
1,513,526 |
174,507 |
306,842 |
241,354 |
2,143,593 |
27,313,045 |
|
23,338,997 |
| 2004 |
4,418,039 |
56,957 |
19,541,918 |
1,612,082 |
185,379 |
330,933 |
287,333 |
2,242,046 |
28,674,687 |
|
24,594,286 |
| 2005 |
4,655,413 |
58,248 |
20,250,377 |
1,805,827 |
194,206 |
353,946 |
339,259 |
2,311,773 |
29,969,049 |
|
25,747,209 |
| 2006 |
4,910,257 |
60,385 |
21,052,559 |
2,058,022 |
204,094 |
380,147 |
388,597 |
2,343,124 |
31,397,185 |
|
27,085,809 |
| 2007 |
5,140,586 |
61,039 |
21,760,174 |
2,311,346 |
212,697 |
404,859 |
427,756 |
2,430,414 |
32,748,871 |
|
28,347,255 |
| 2008 |
5,192,219 |
62,196 |
22,145,364 |
2,500,819 |
213,366 |
418,629 |
436,631 |
2,410,685 |
33,379,909 |
|
28,839,766 |
| 2009 |
5,136,214 |
62,663 |
21,983,485 |
2,606,674 |
206,730 |
412,840 |
447,363 |
2,352,205 |
33,208,174 |
|
28,788,437 |
| 2010 |
5,103,980 |
62,445 |
22,147,455 |
2,707,482 |
199,486 |
414,673 |
450,514 |
2,290,207 |
33,376,242 |
|
28,700,325 |
| 2011 |
5,060,791 |
62,358 |
22,277,244 |
2,798,043 |
195,960 |
415,568 |
459,117 |
2,229,418 |
33,498,499 |
|
28,913,319 |
| 2012 |
4,984,722 |
61,127 |
22,247,528 |
2,852,297 |
186,964 |
410,369 |
460,196 |
2,169,668 |
33,372,871 |
|
28,724,457 |
| 2013 |
4,887,352 |
59,892 |
22,024,538 |
2,891,204 |
182,822 |
407,847 |
463,181 |
2,107,116 |
33,023,952 |
|
28,597,783 |
| 2014 |
4,839,484 |
59,799 |
22,029,512 |
2,972,165 |
186,060 |
413,155 |
475,872 |
2,061,044 |
33,037,091 |
|
28,801,437 |
| 2015 |
4,851,518 |
60,252 |
22,355,549 |
3,079,463 |
195,657 |
426,510 |
420,734 |
2,023,211 |
33,412,894 |
|
29,125,792 |
| 2016 |
4,879,480 |
61,838 |
22,876,830 |
3,211,474 |
207,889 |
443,598 |
425,411 |
1,987,470 |
34,093,990 |
|
29,838,361 |
| 2017 |
4,924,476 |
63,589 |
23,500,401 |
3,327,048 |
218,154 |
459,712 |
435,624 |
1,961,523 |
34,890,527 |
|
30,613,146 |
| 2018 |
4,980,911 |
64,905 |
24,074,151 |
3,459,722 |
225,942 |
474,737 |
449,614 |
1,933,445 |
35,663,427 |
|
31,452,863 |
| 2019 |
5,015,973 |
65,470 |
24,558,126 |
3,607,226 |
232,680 |
487,823 |
467,493 |
1,908,492 |
36,343,283 |
|
31,776,323 |
| 2020(*) |
-- |
-- |
-- |
-- |
-- |
-- |
-- |
-- |
36,660,225 |
|
32,023,762 |
| TOTAL 2001-2019 |
91,211,201 |
1,152,255 |
410,397,043 |
48,315,070 |
3,745,564 |
7,703,853 |
7,288,879 |
40,756,434 |
610,570,299 |
|
527,652,173 |
| % 2019 |
14% |
0% |
68% |
10% |
1% |
1% |
1% |
5% |
100% |
|
|
Data from the Directorate-General for Traffic and CCS (FIVA).
(*) Provisional data.
(*) The figure for the total number of motor vehicles for 2020 is provisional.
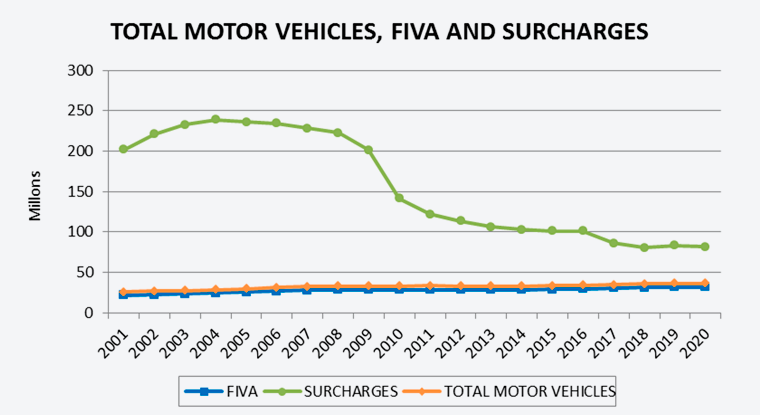
In 2019 68% of motor vehicles were passenger cars. That percentage has held steady over the course of the time series considered. The trend in total motor vehicles has been upward except for 2009-2014, when it flattened out.
The difference in the total number of motor vehicles and the total number of insured vehicles on record in the FIVA database has held constant at around 4.4 million vehicles, around 14% of the total. This does not mean that the difference represents uninsured vehicles still in operation in Spain. The basis for tallying the total number of motor vehicles is not exactly the same as the tally in the FIVA database, because the former tally includes vehicles that are no longer in use but have not yet been taken off the registers kept by the traffic authorities.
2. Total surcharges collected
In current euros as of 31 December 2020
| Year |
Amount |
% increase
up on previous year |
| 2001 |
201,866,890 |
16% |
| 2002 |
220,730,726 |
9% |
| 2003 |
232,572,154 |
5% |
| 2004 |
238,720,434 |
3% |
| 2005 |
236,054,609 |
-1% |
| 2006 |
234,247,697 |
-1% |
| 2007 |
228,085,841 |
-3% |
| 2008 |
222,913,306 |
-2% |
| 2009 |
201,281,472 |
-10% |
| 2010 |
141,521,069 |
-30% |
| 2011 |
121,899,951 |
-14% |
| 2012 |
113,408,902 |
-7% |
| 2013 |
106,367,990 |
-6% |
| 2014 |
102,803,917 |
-3% |
| 2015 |
101,181,772 |
-2% |
| 2016 |
101,186,323 |
0% |
| 2017 |
86,306,121 |
-15% |
| 2018 |
80,629,006 |
-7% |
| 2019 |
83,211,215 |
3% |
| 2020 |
82,045,100 |
-1% |
| TOTAL |
3,137,034,493 |
|
Surchages incurred.
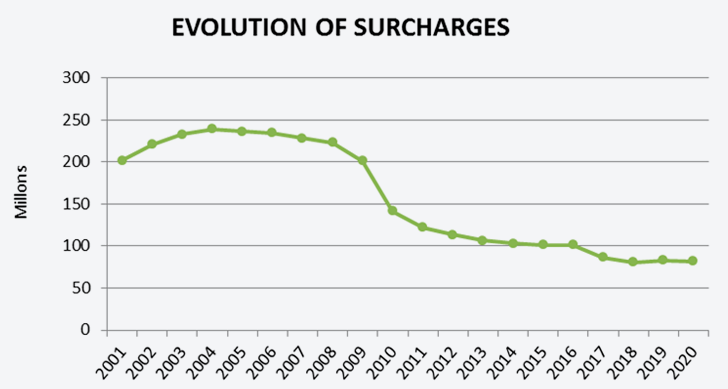
Despite the growth in the number of insured vehicles, the trend for total surcharges for the Guarantee Fund collected by the CCS has been just the opposite. This difference can be accounted for in large part by the successive reductions in the applicable rate, from 3% at the start, to 2% after 1 July 2009, and then to 1.5% from 1 July 2016 to the present. The other factor responsible for the downward trend in the total surcharges is the mean compulsory insurance premium charged by insurers for civil liability for motor vehicle operators.
Section 2: loss rate statistics, time series for 2001-2020
I. Uninsured vehicles
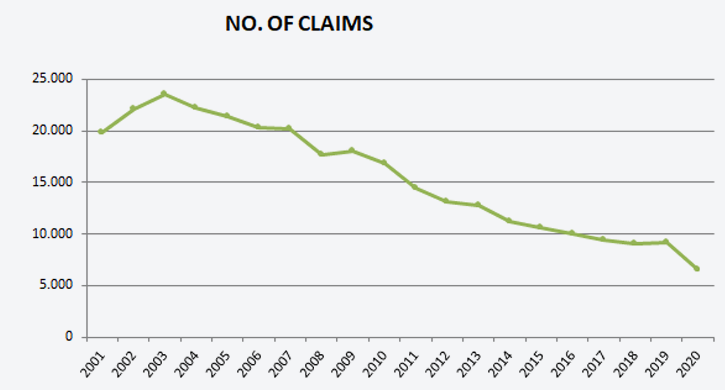
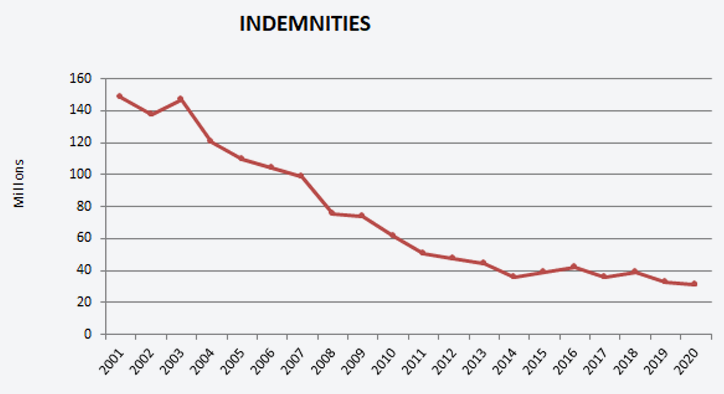
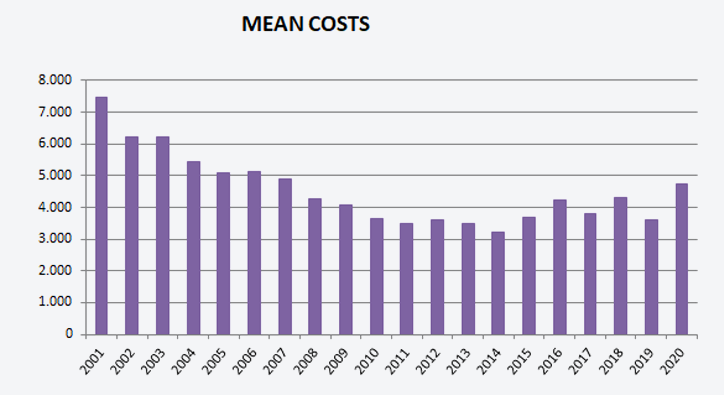
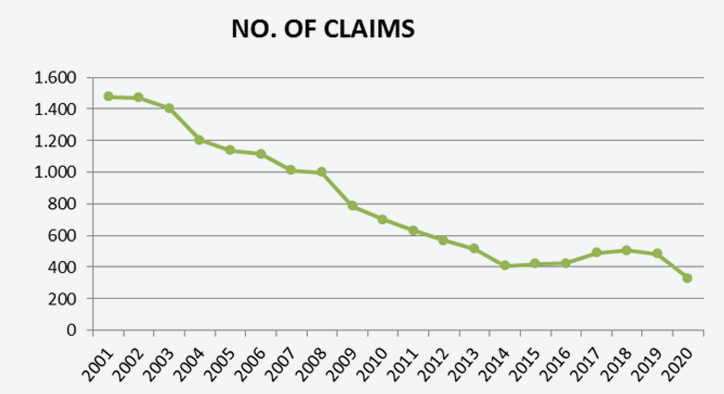
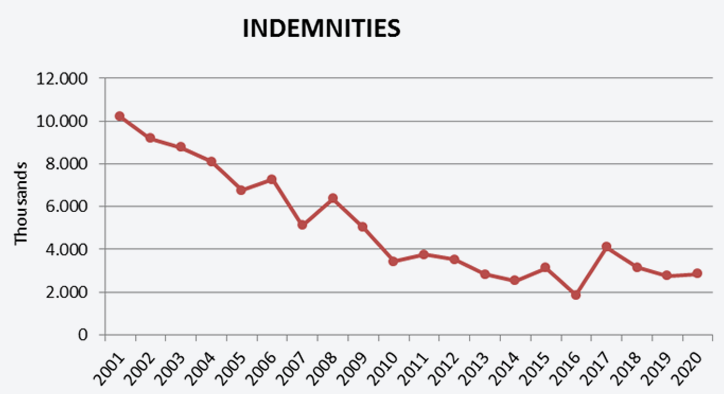
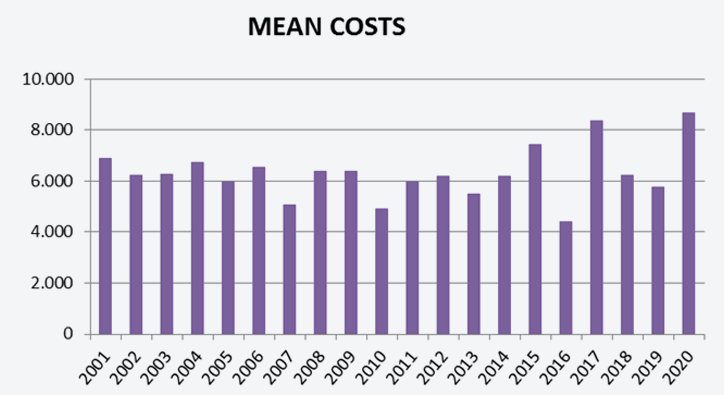
1. Number of claims, indemnities paid out, and mean costs for losses caused by uninsured vehicles paid for by the CCS by year of occurrence In current euros as of 31 December 2020
| Year |
Nº of claims |
Indemnities |
Mean costs |
| 2001 |
19,863 |
148,759,295 |
7,489 |
| 2002 |
22,072 |
137,271,515 |
6,219 |
| 2003 |
23,508 |
146,637,840 |
6,238 |
| 2004 |
22,171 |
120,447,644 |
5,433 |
| 2005 |
21,429 |
109,327,077 |
5,102 |
| 2006 |
20,256 |
104,134,280 |
5,141 |
| 2007 |
20,160 |
98,981,337 |
4,910 |
| 2008 |
17,634 |
75,653,185 |
4,290 |
| 2009 |
18,041 |
73,892,257 |
4,096 |
| 2010 |
16,882 |
61,559,491 |
3,646 |
| 2011 |
14,429 |
50,557,697 |
3,504 |
| 2012 |
13,103 |
47,406,065 |
3,618 |
| 2013 |
12,752 |
44,399,260 |
3,482 |
| 2014 |
11,220 |
36,012,736 |
3,210 |
| 2015 |
10,643 |
39,199,877 |
3,683 |
| 2016 |
9,983 |
42,158,766 |
4,223 |
| 2017 |
9,379 |
35,682,427 |
3,805 |
| 2018 |
9,093 |
39,242,903 |
4,316 |
| 2019 |
9,161 |
32,960,617 |
3,598 |
| 2020 |
6,583 |
31,106,332 |
4,725 |
| TOTAL |
308,362 |
1,475,390,599 |
4,785 |
The number of claims and the corresponding amount of compensation paid out have been dropping. This trend holds true even when the number of losses occurring in the period that have not yet been claimed (IBNR, incurred but not reported) is added.
Mean costs have gone up since 2015.
These variables have been plotted in the Figures below.
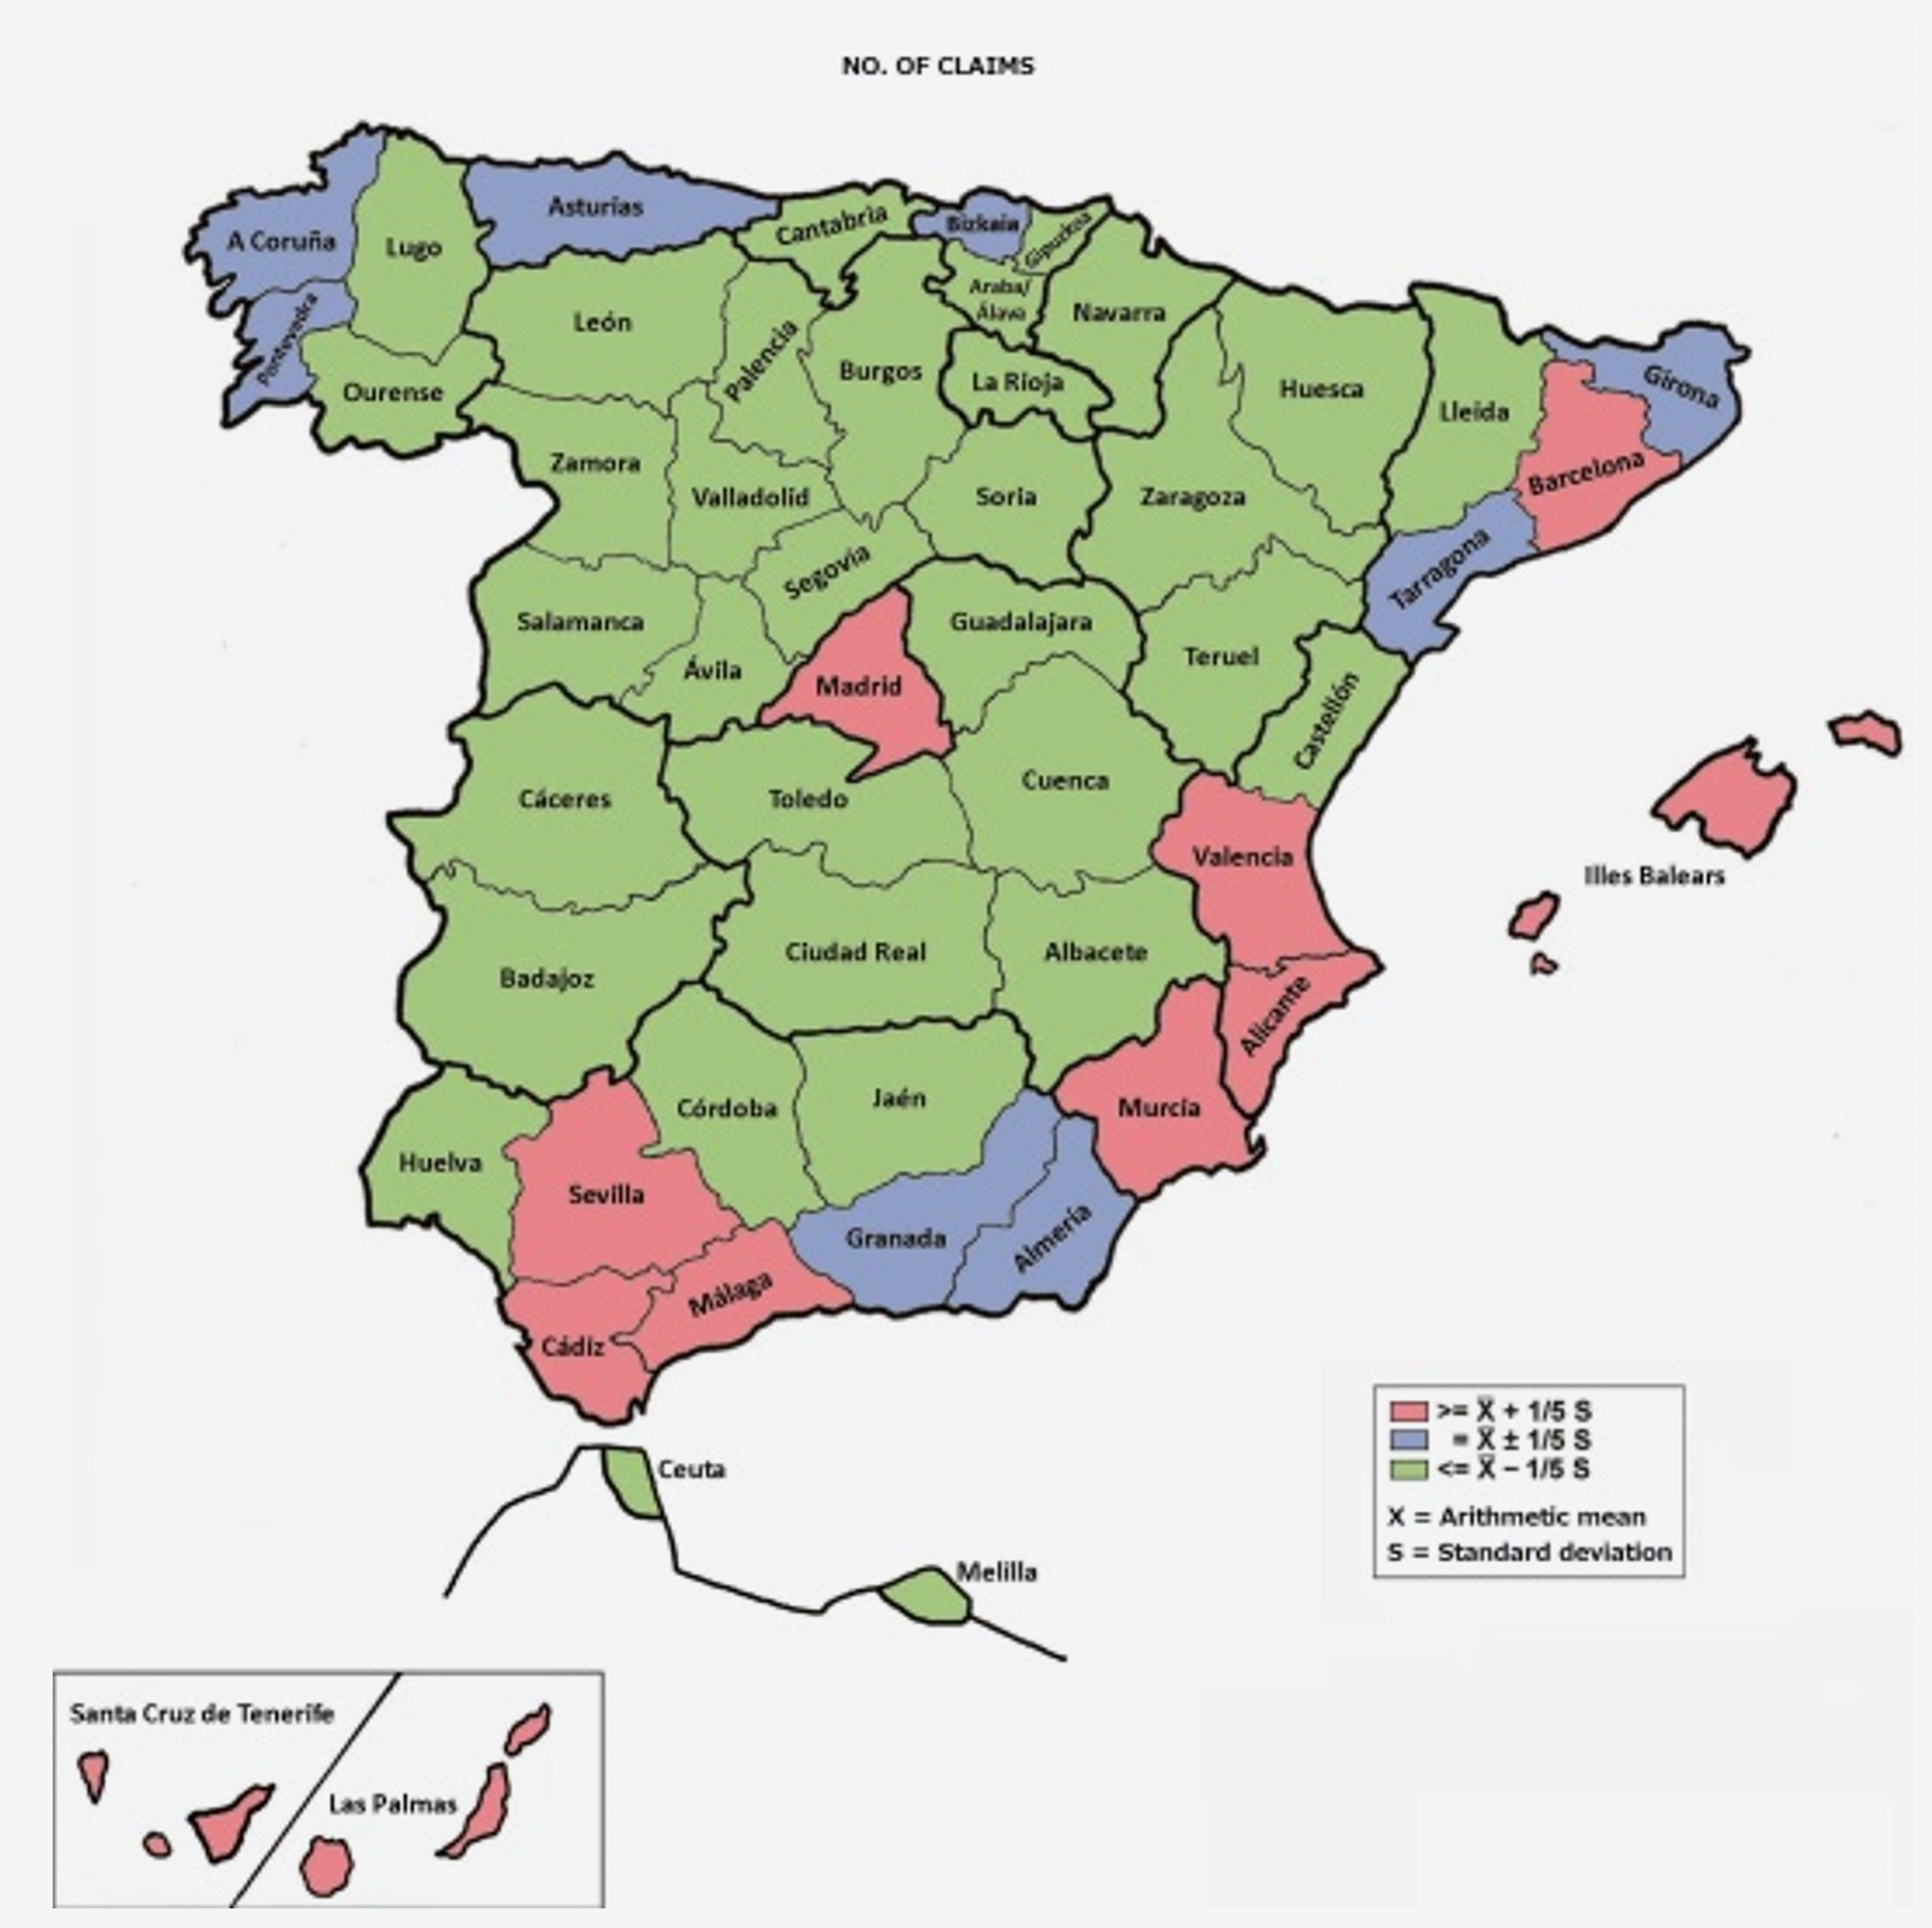
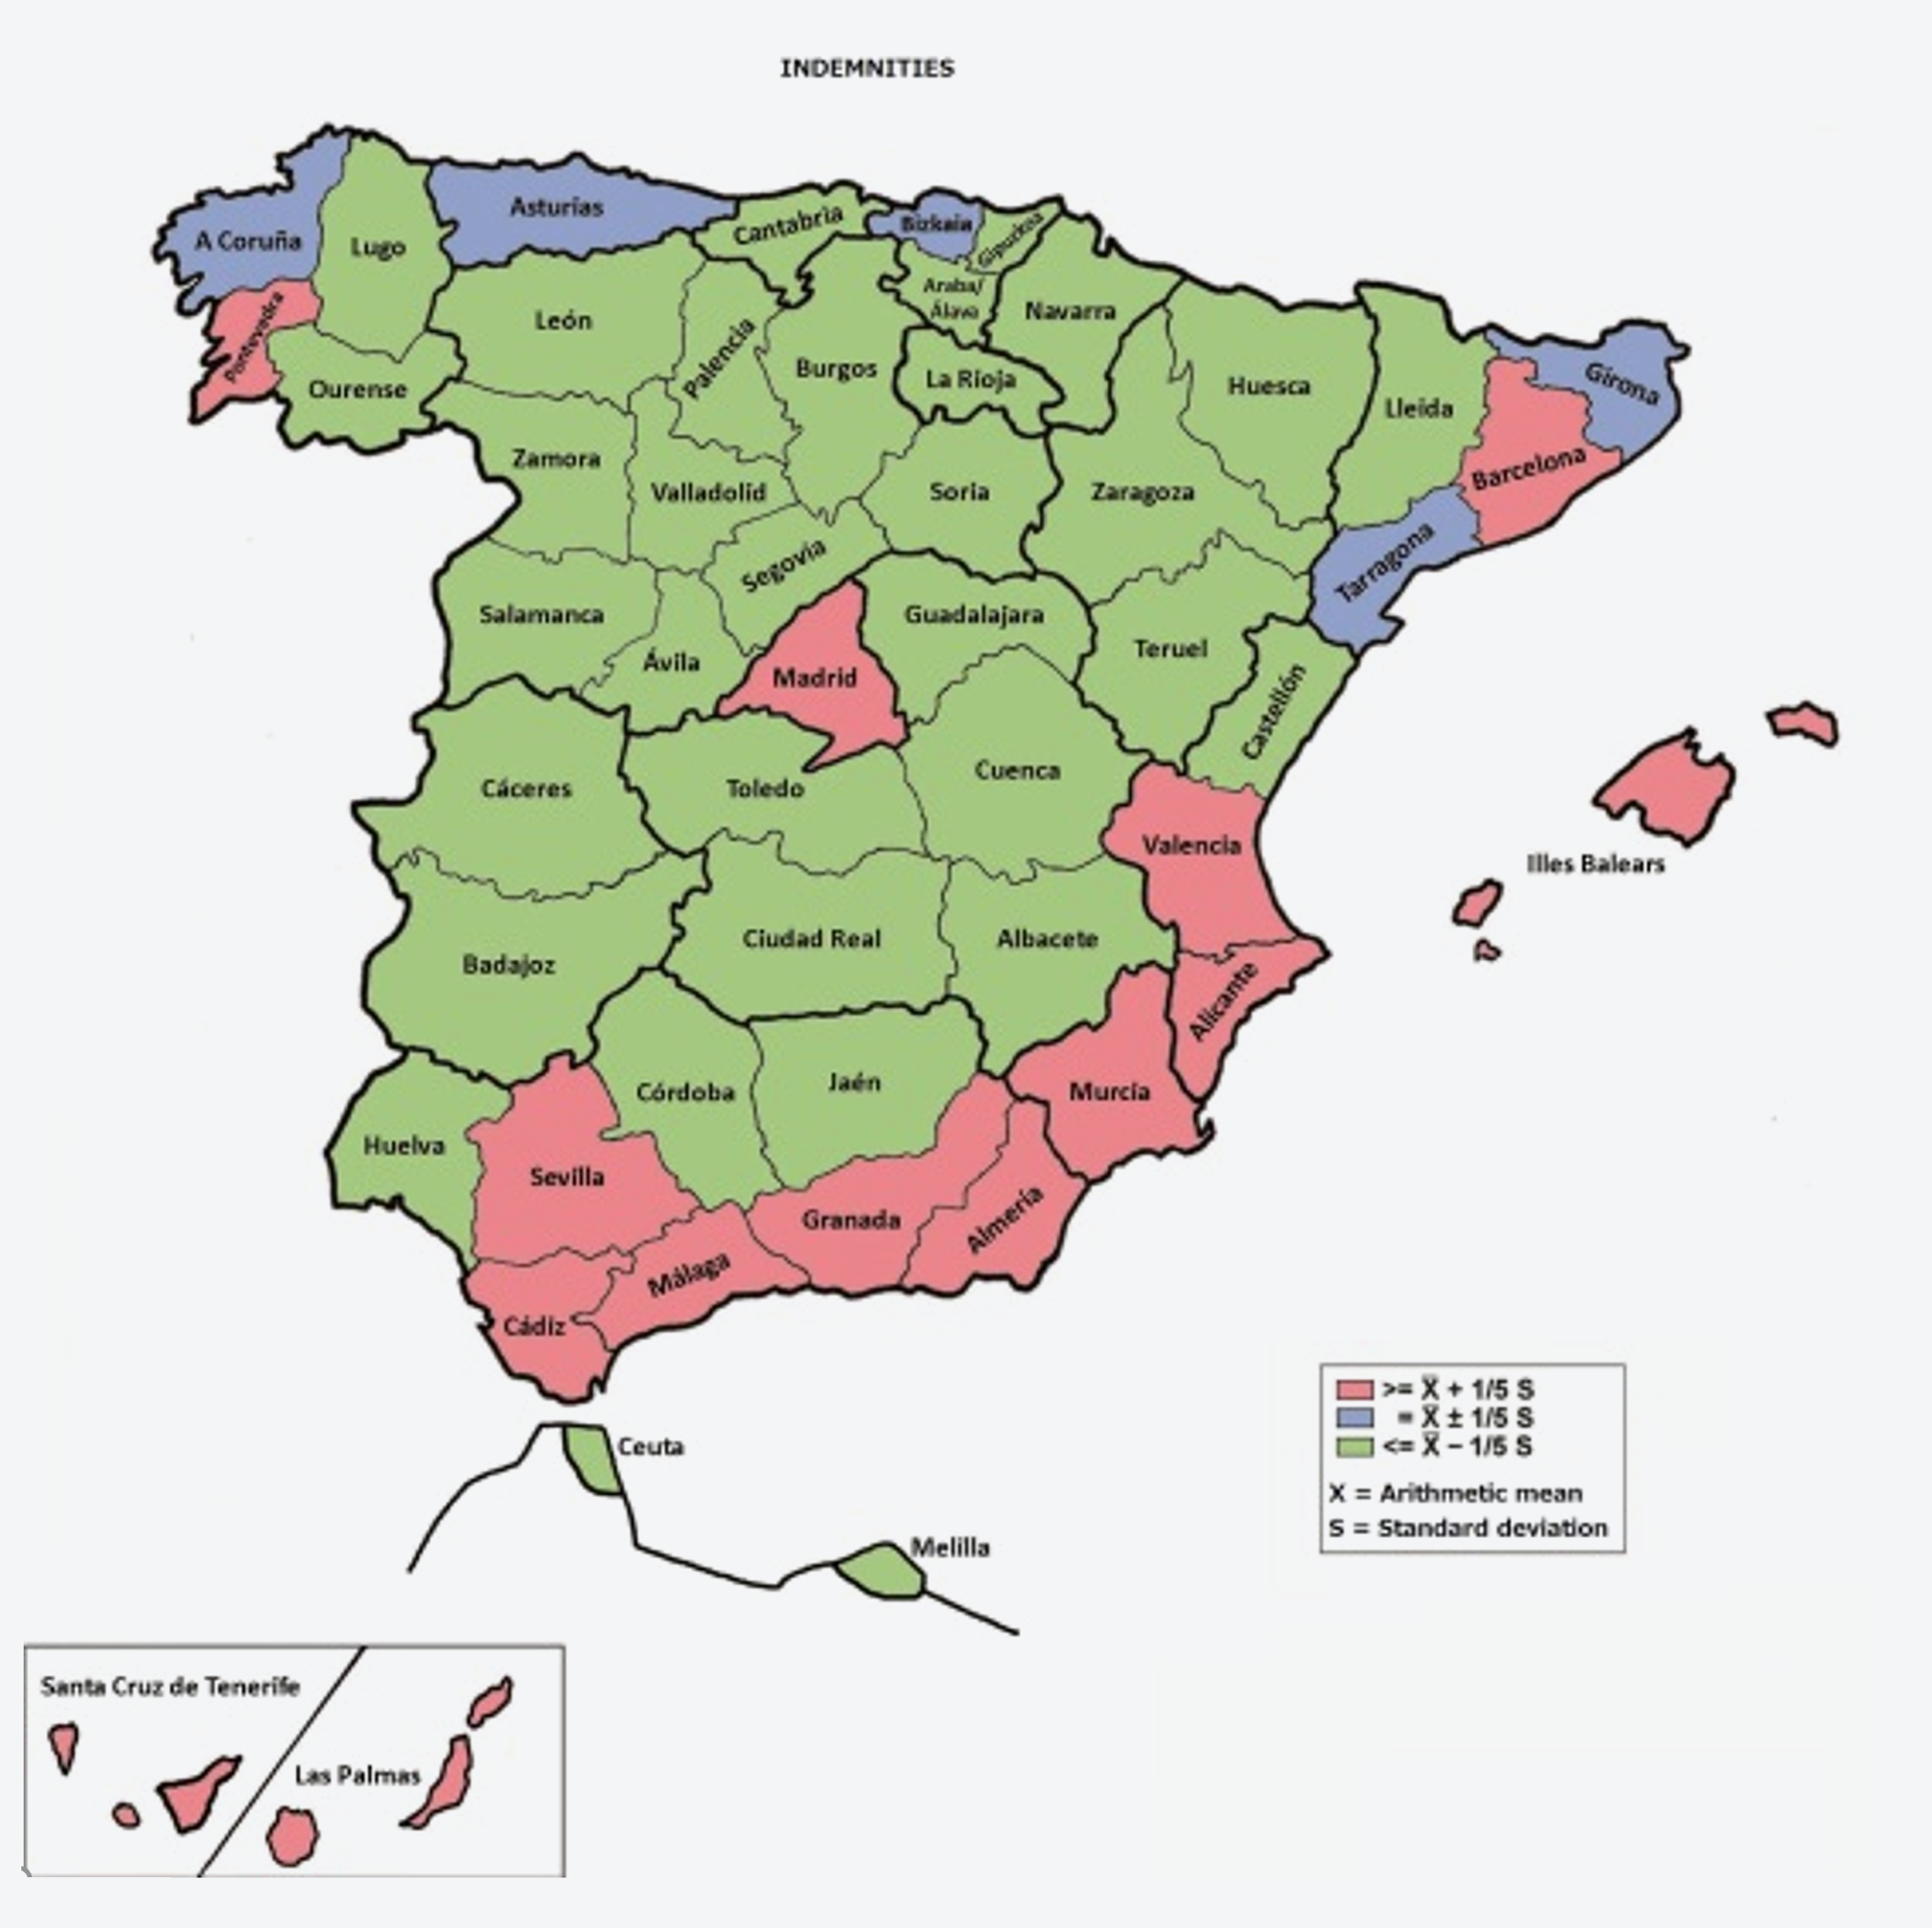
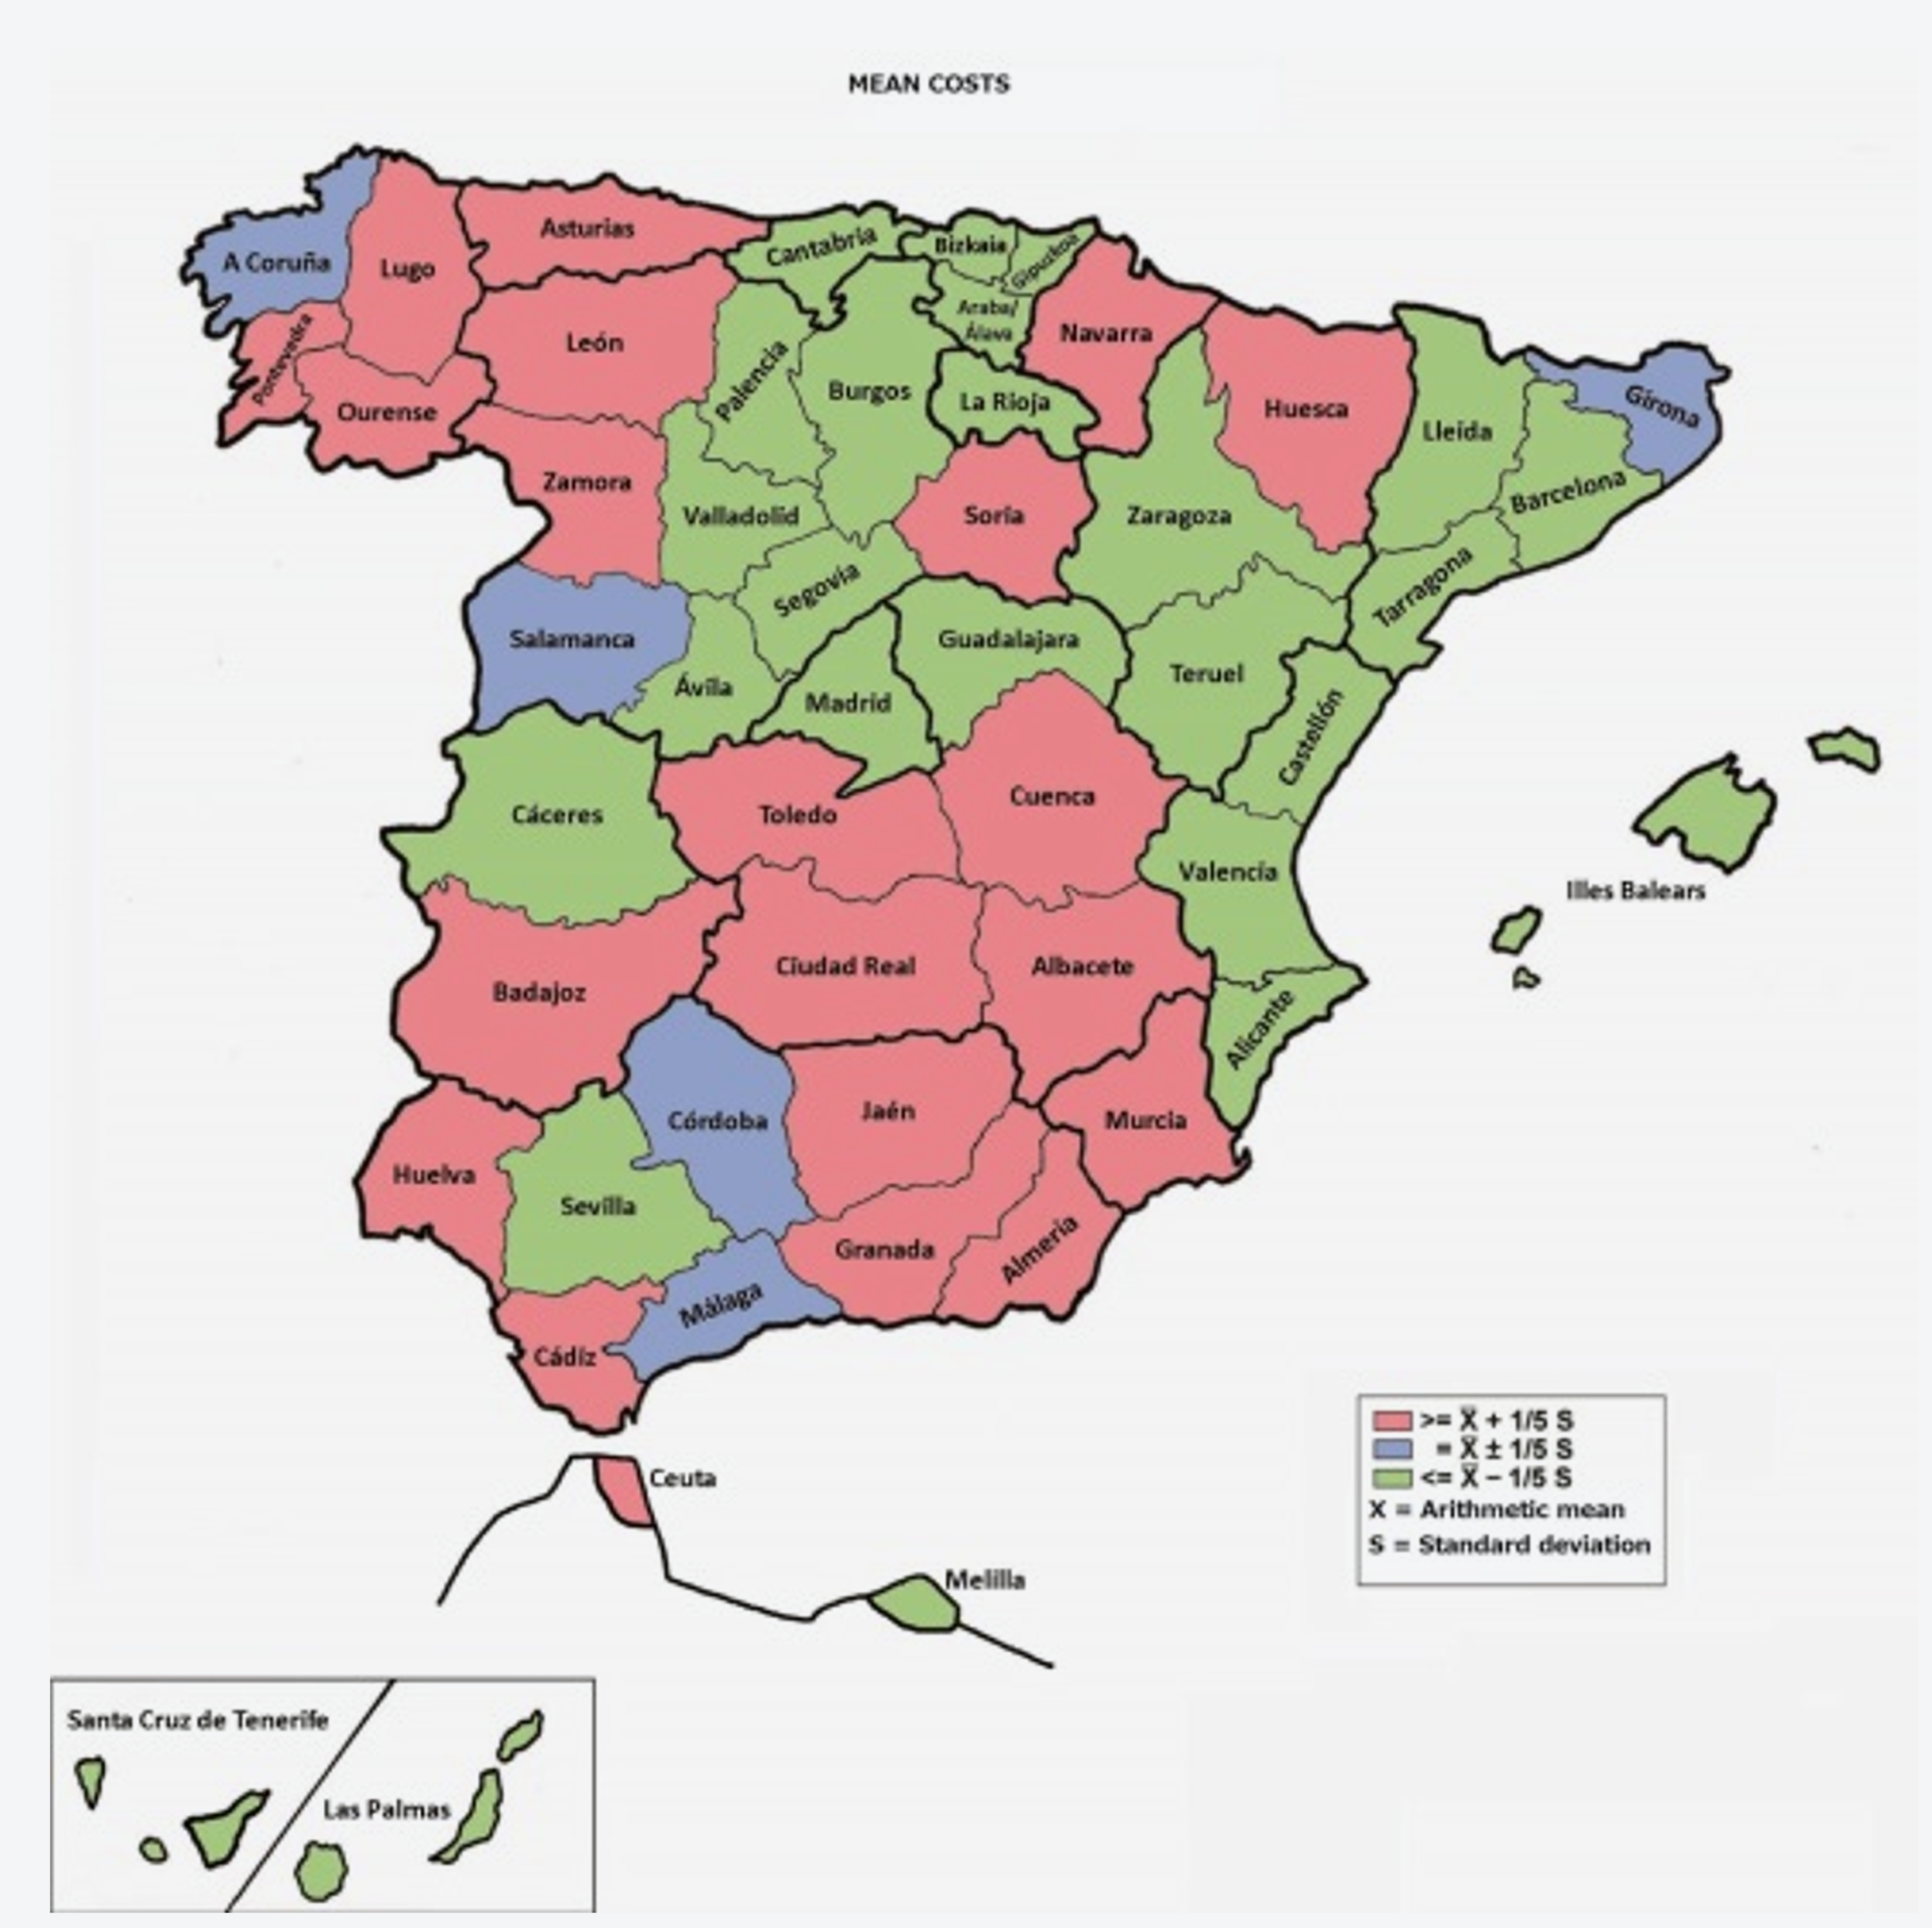
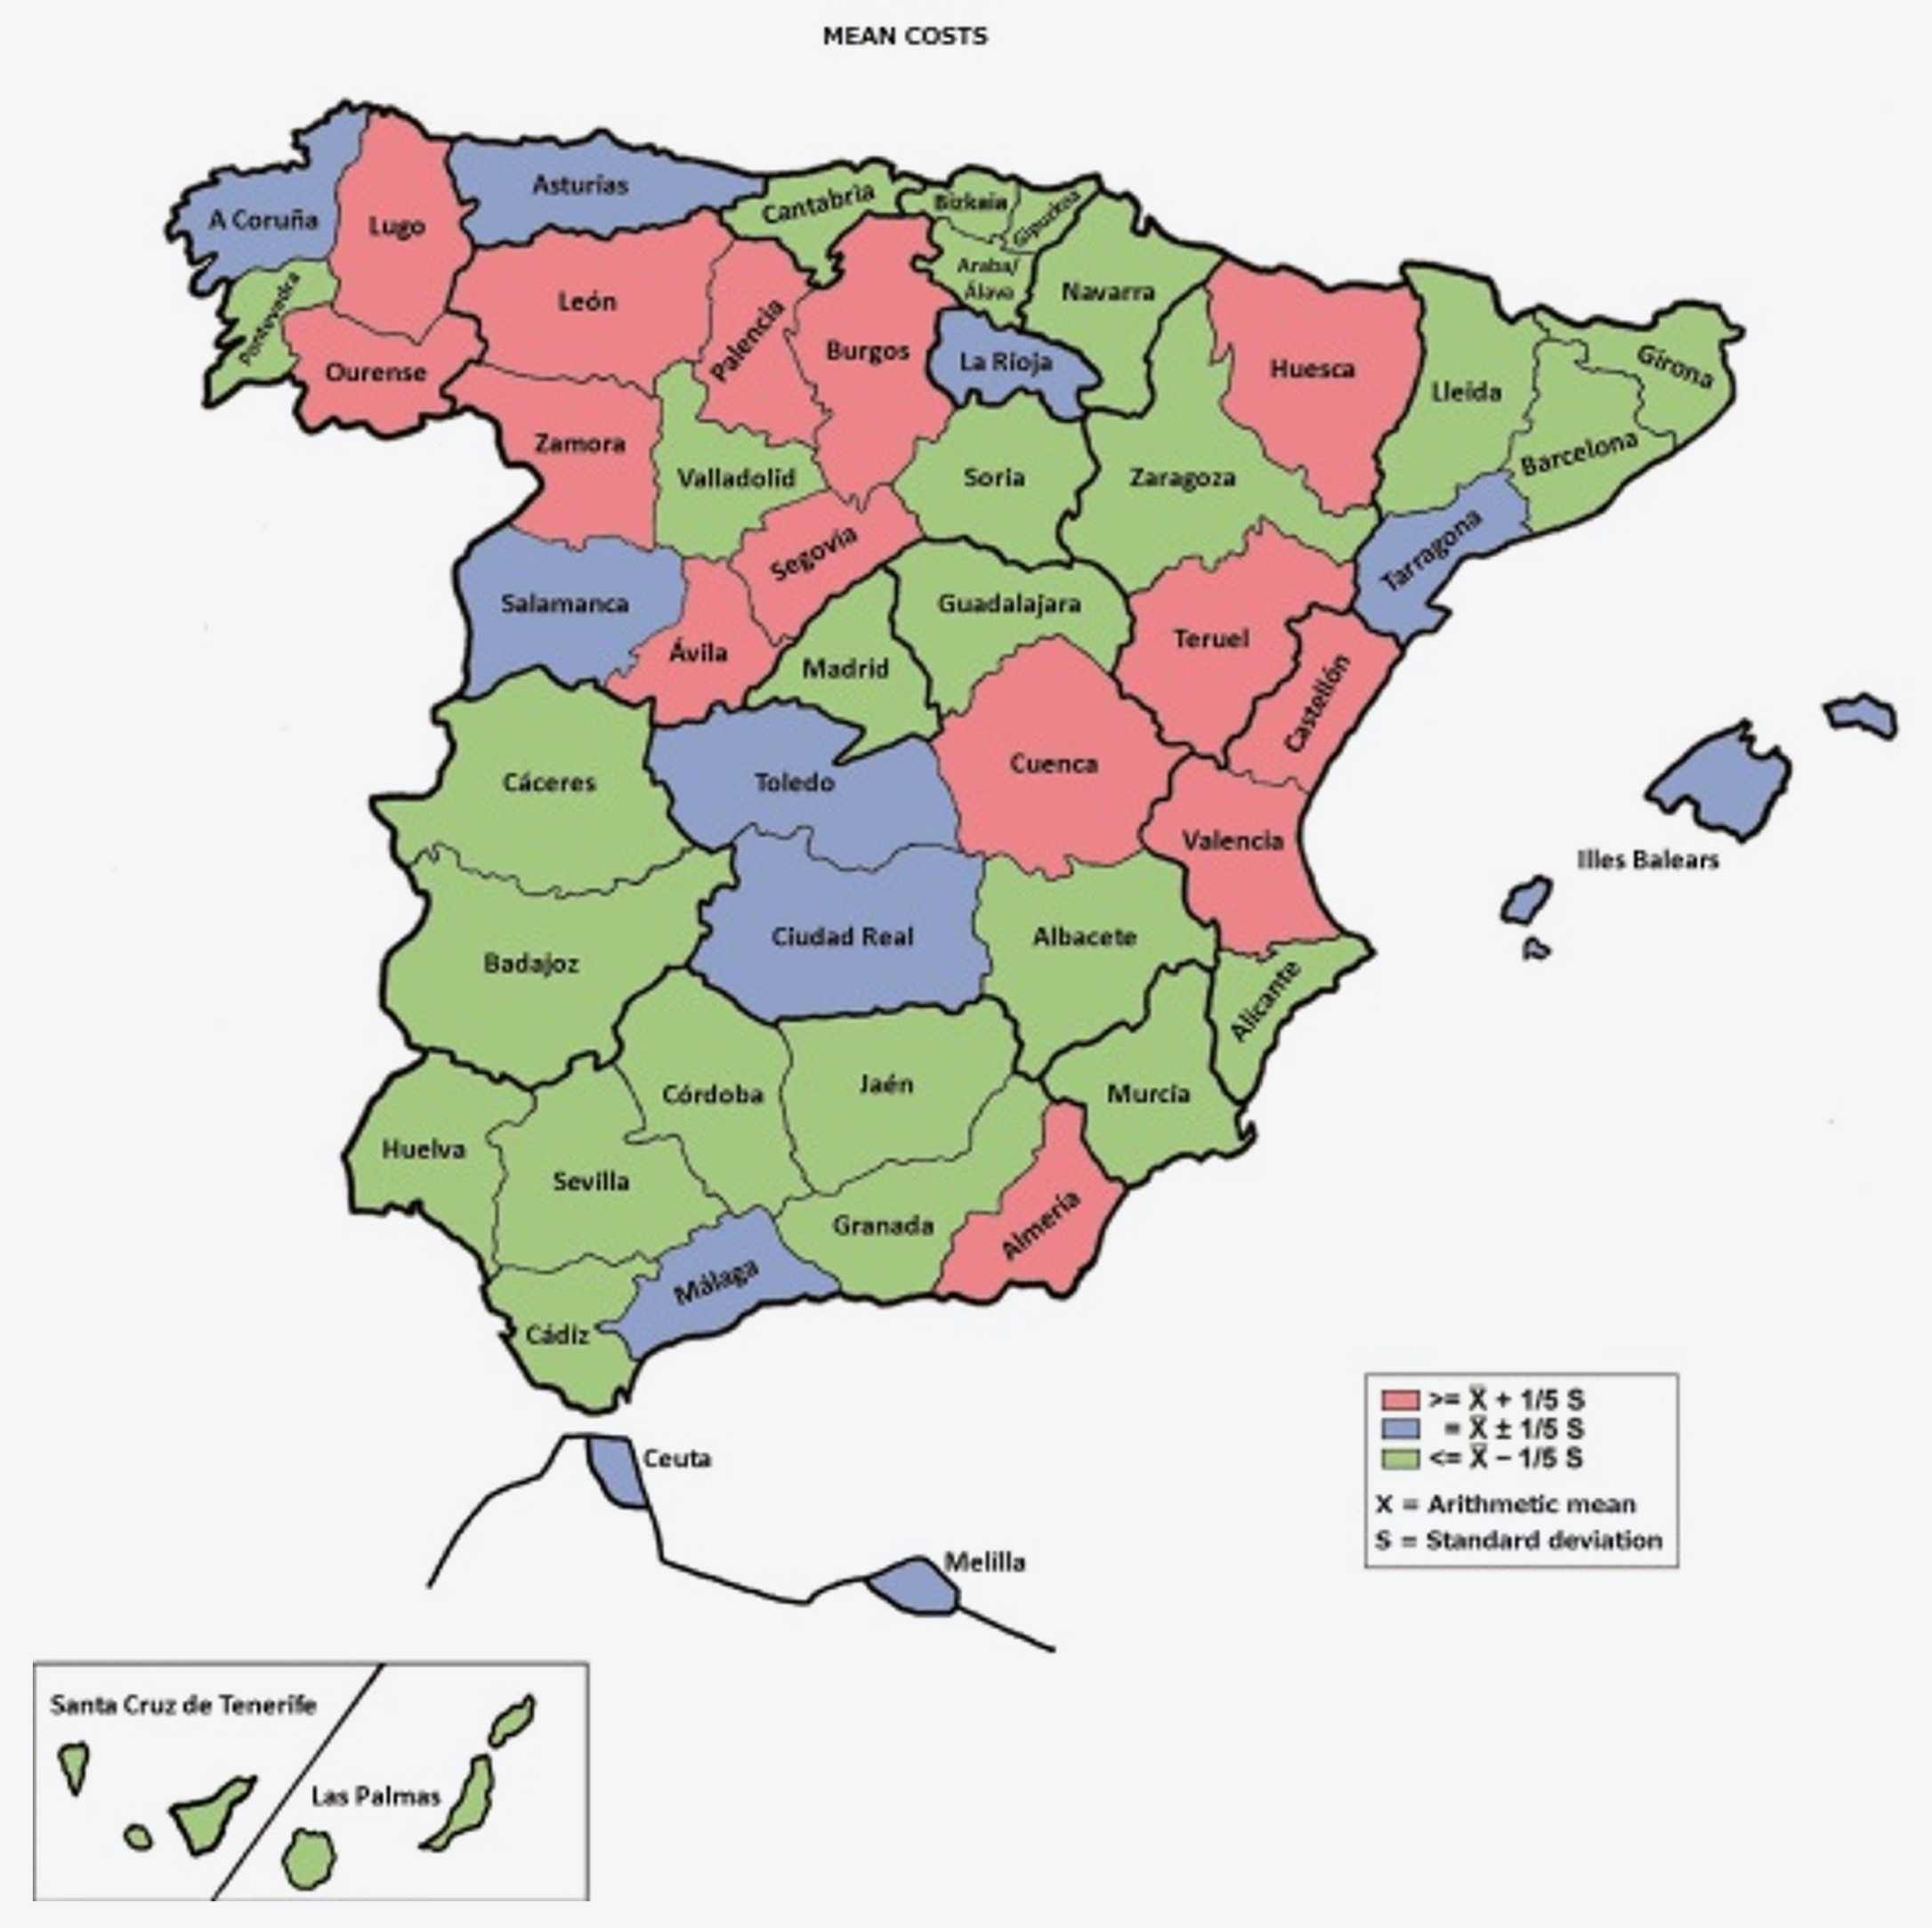
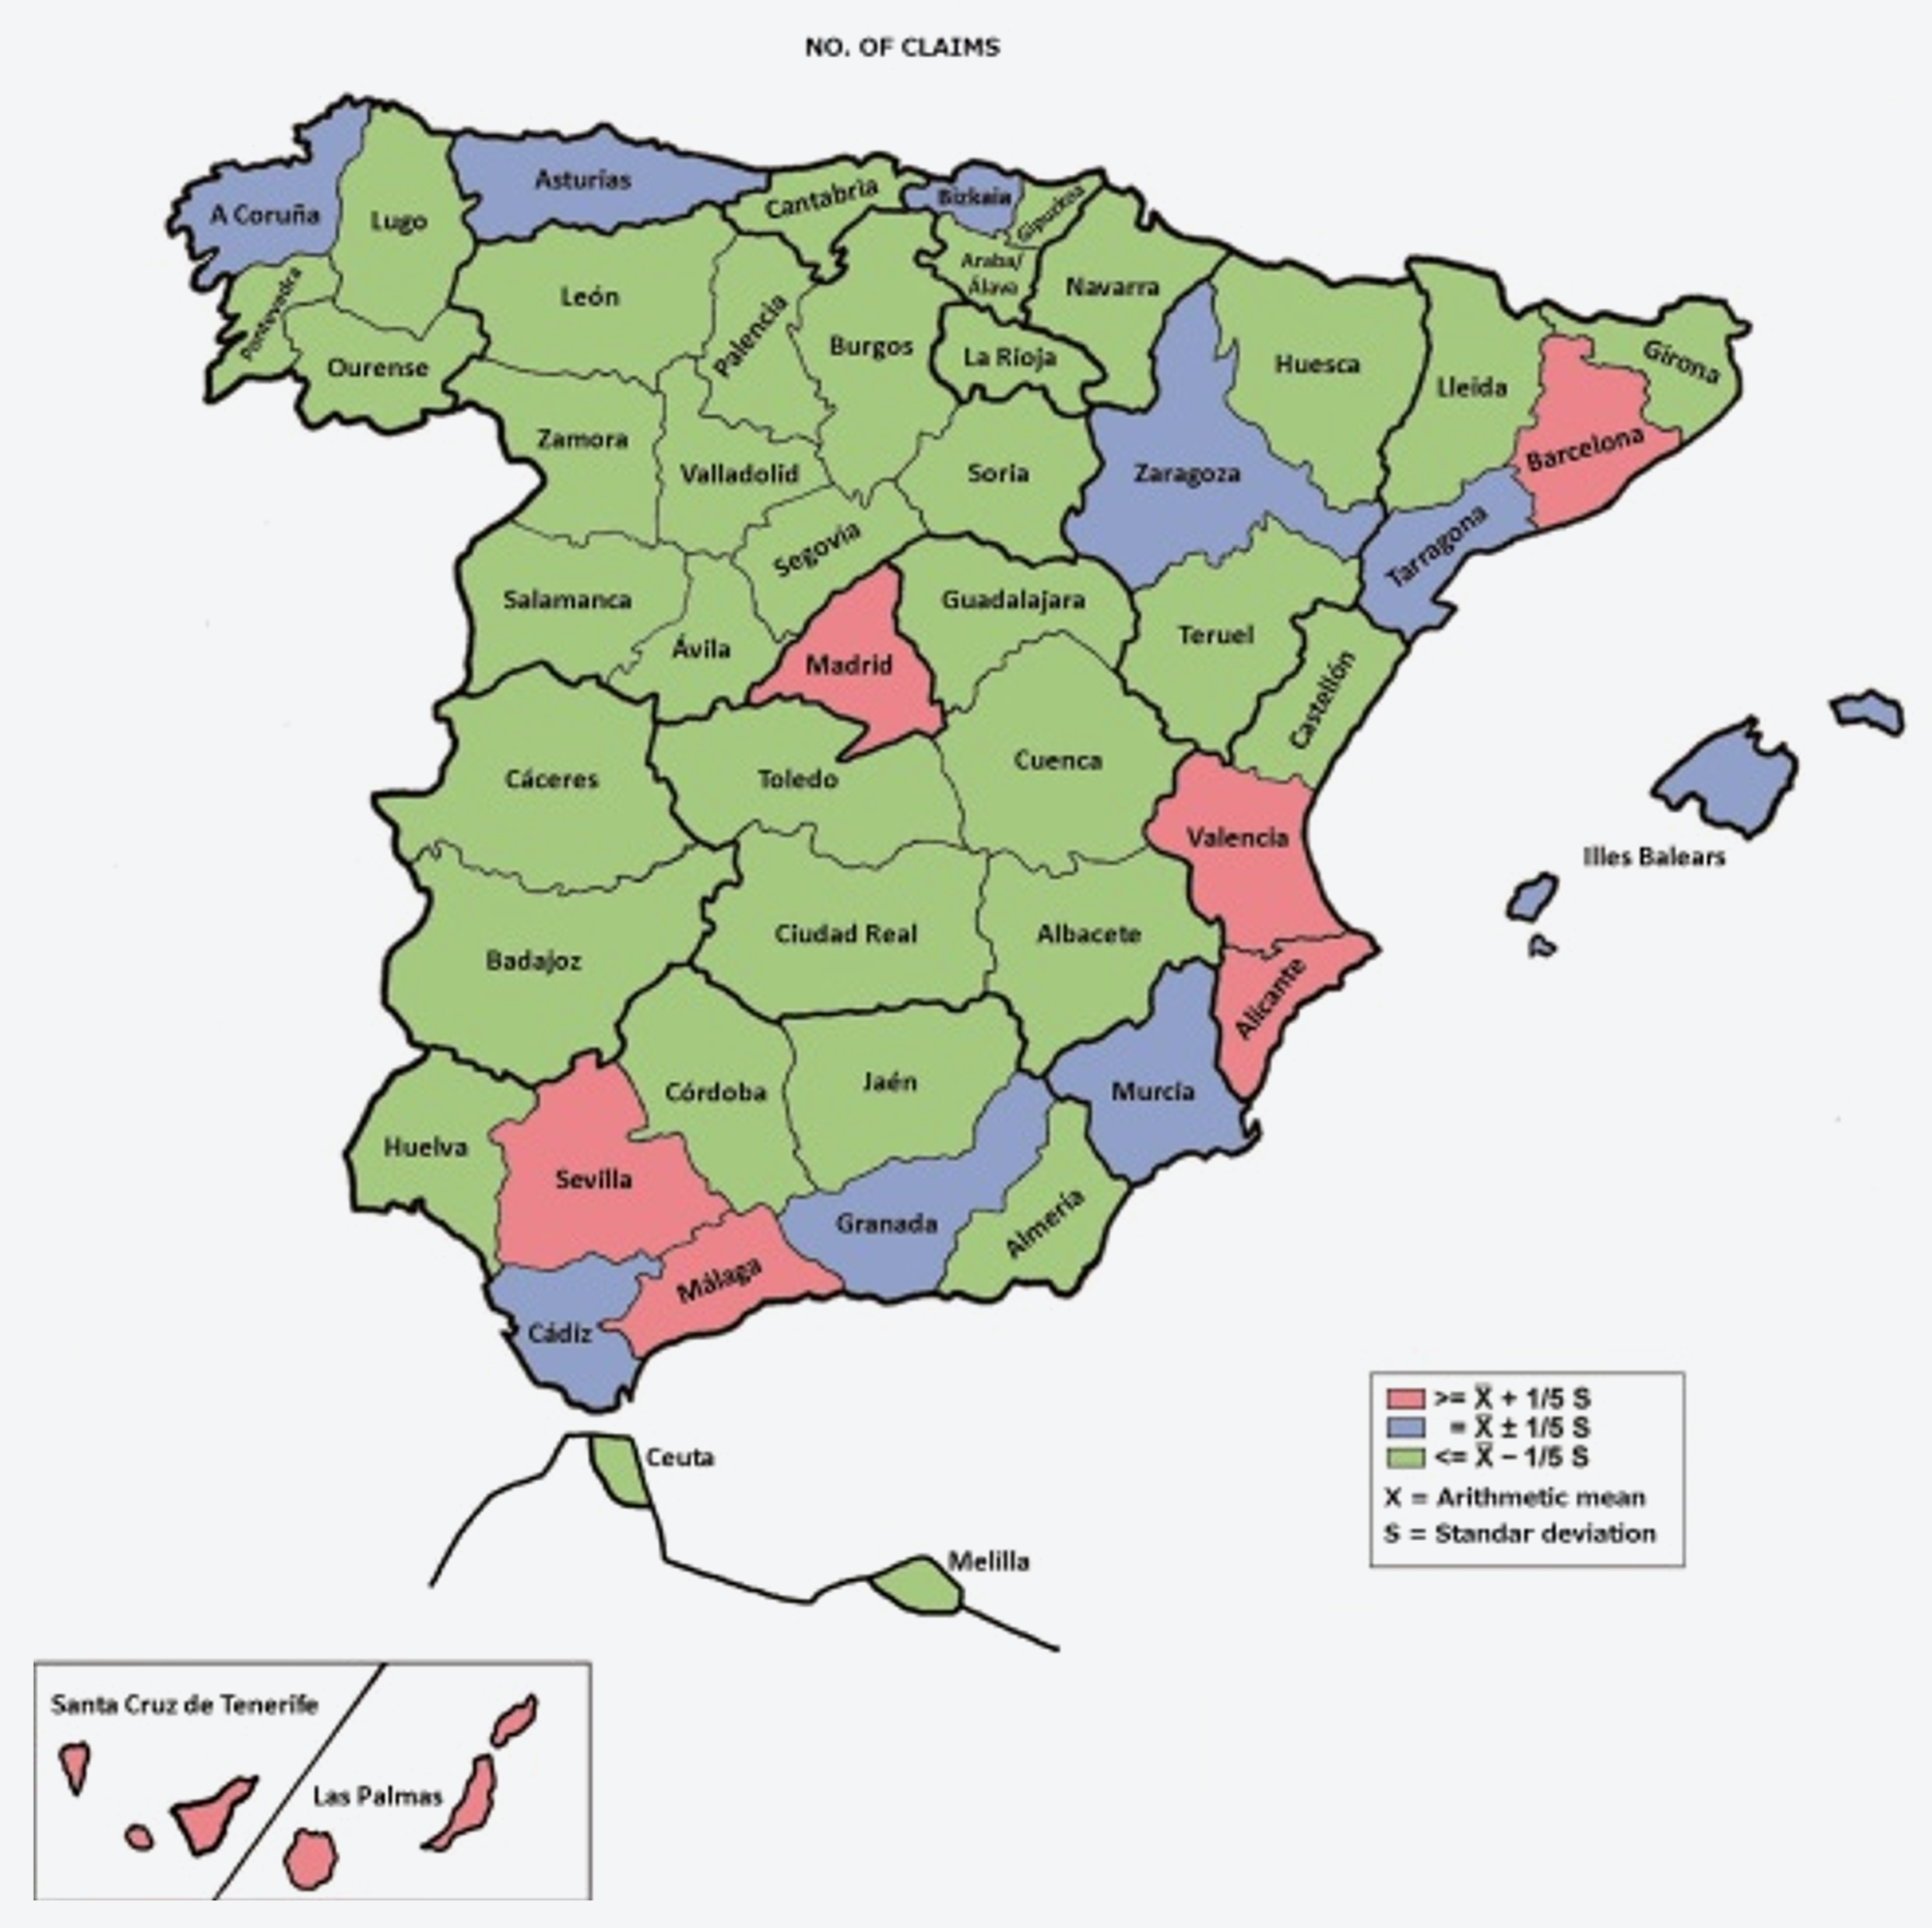
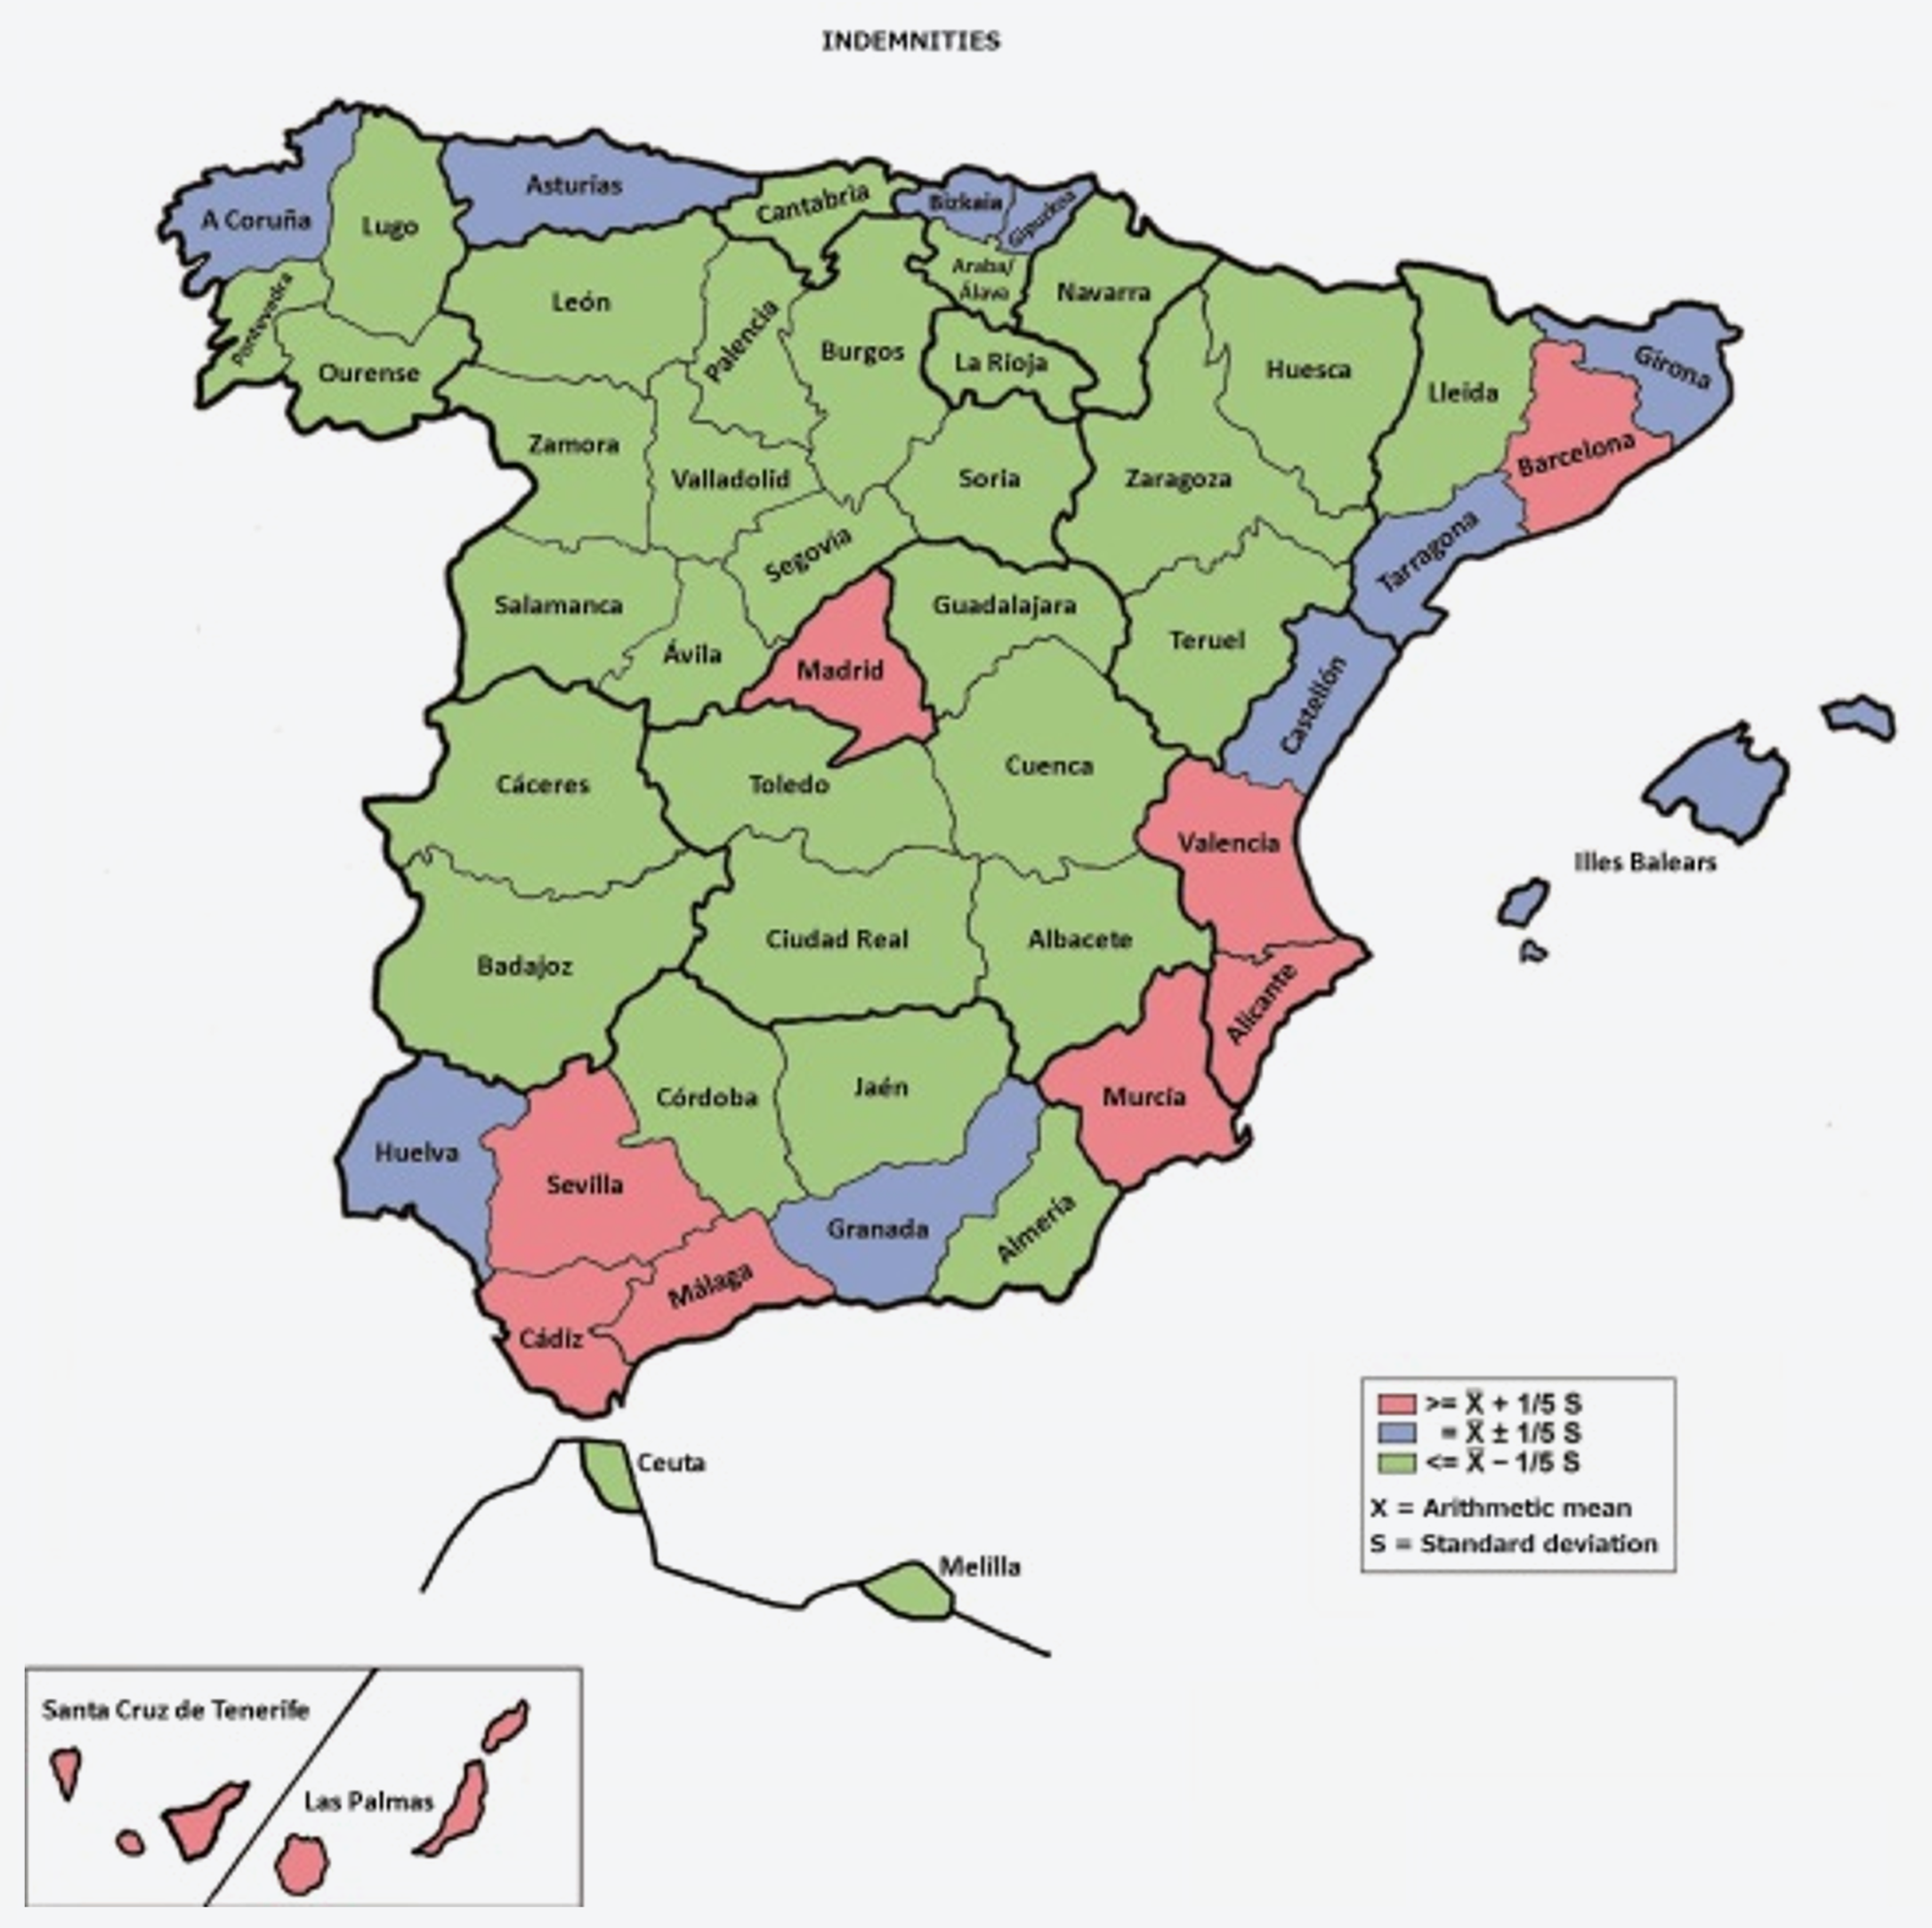
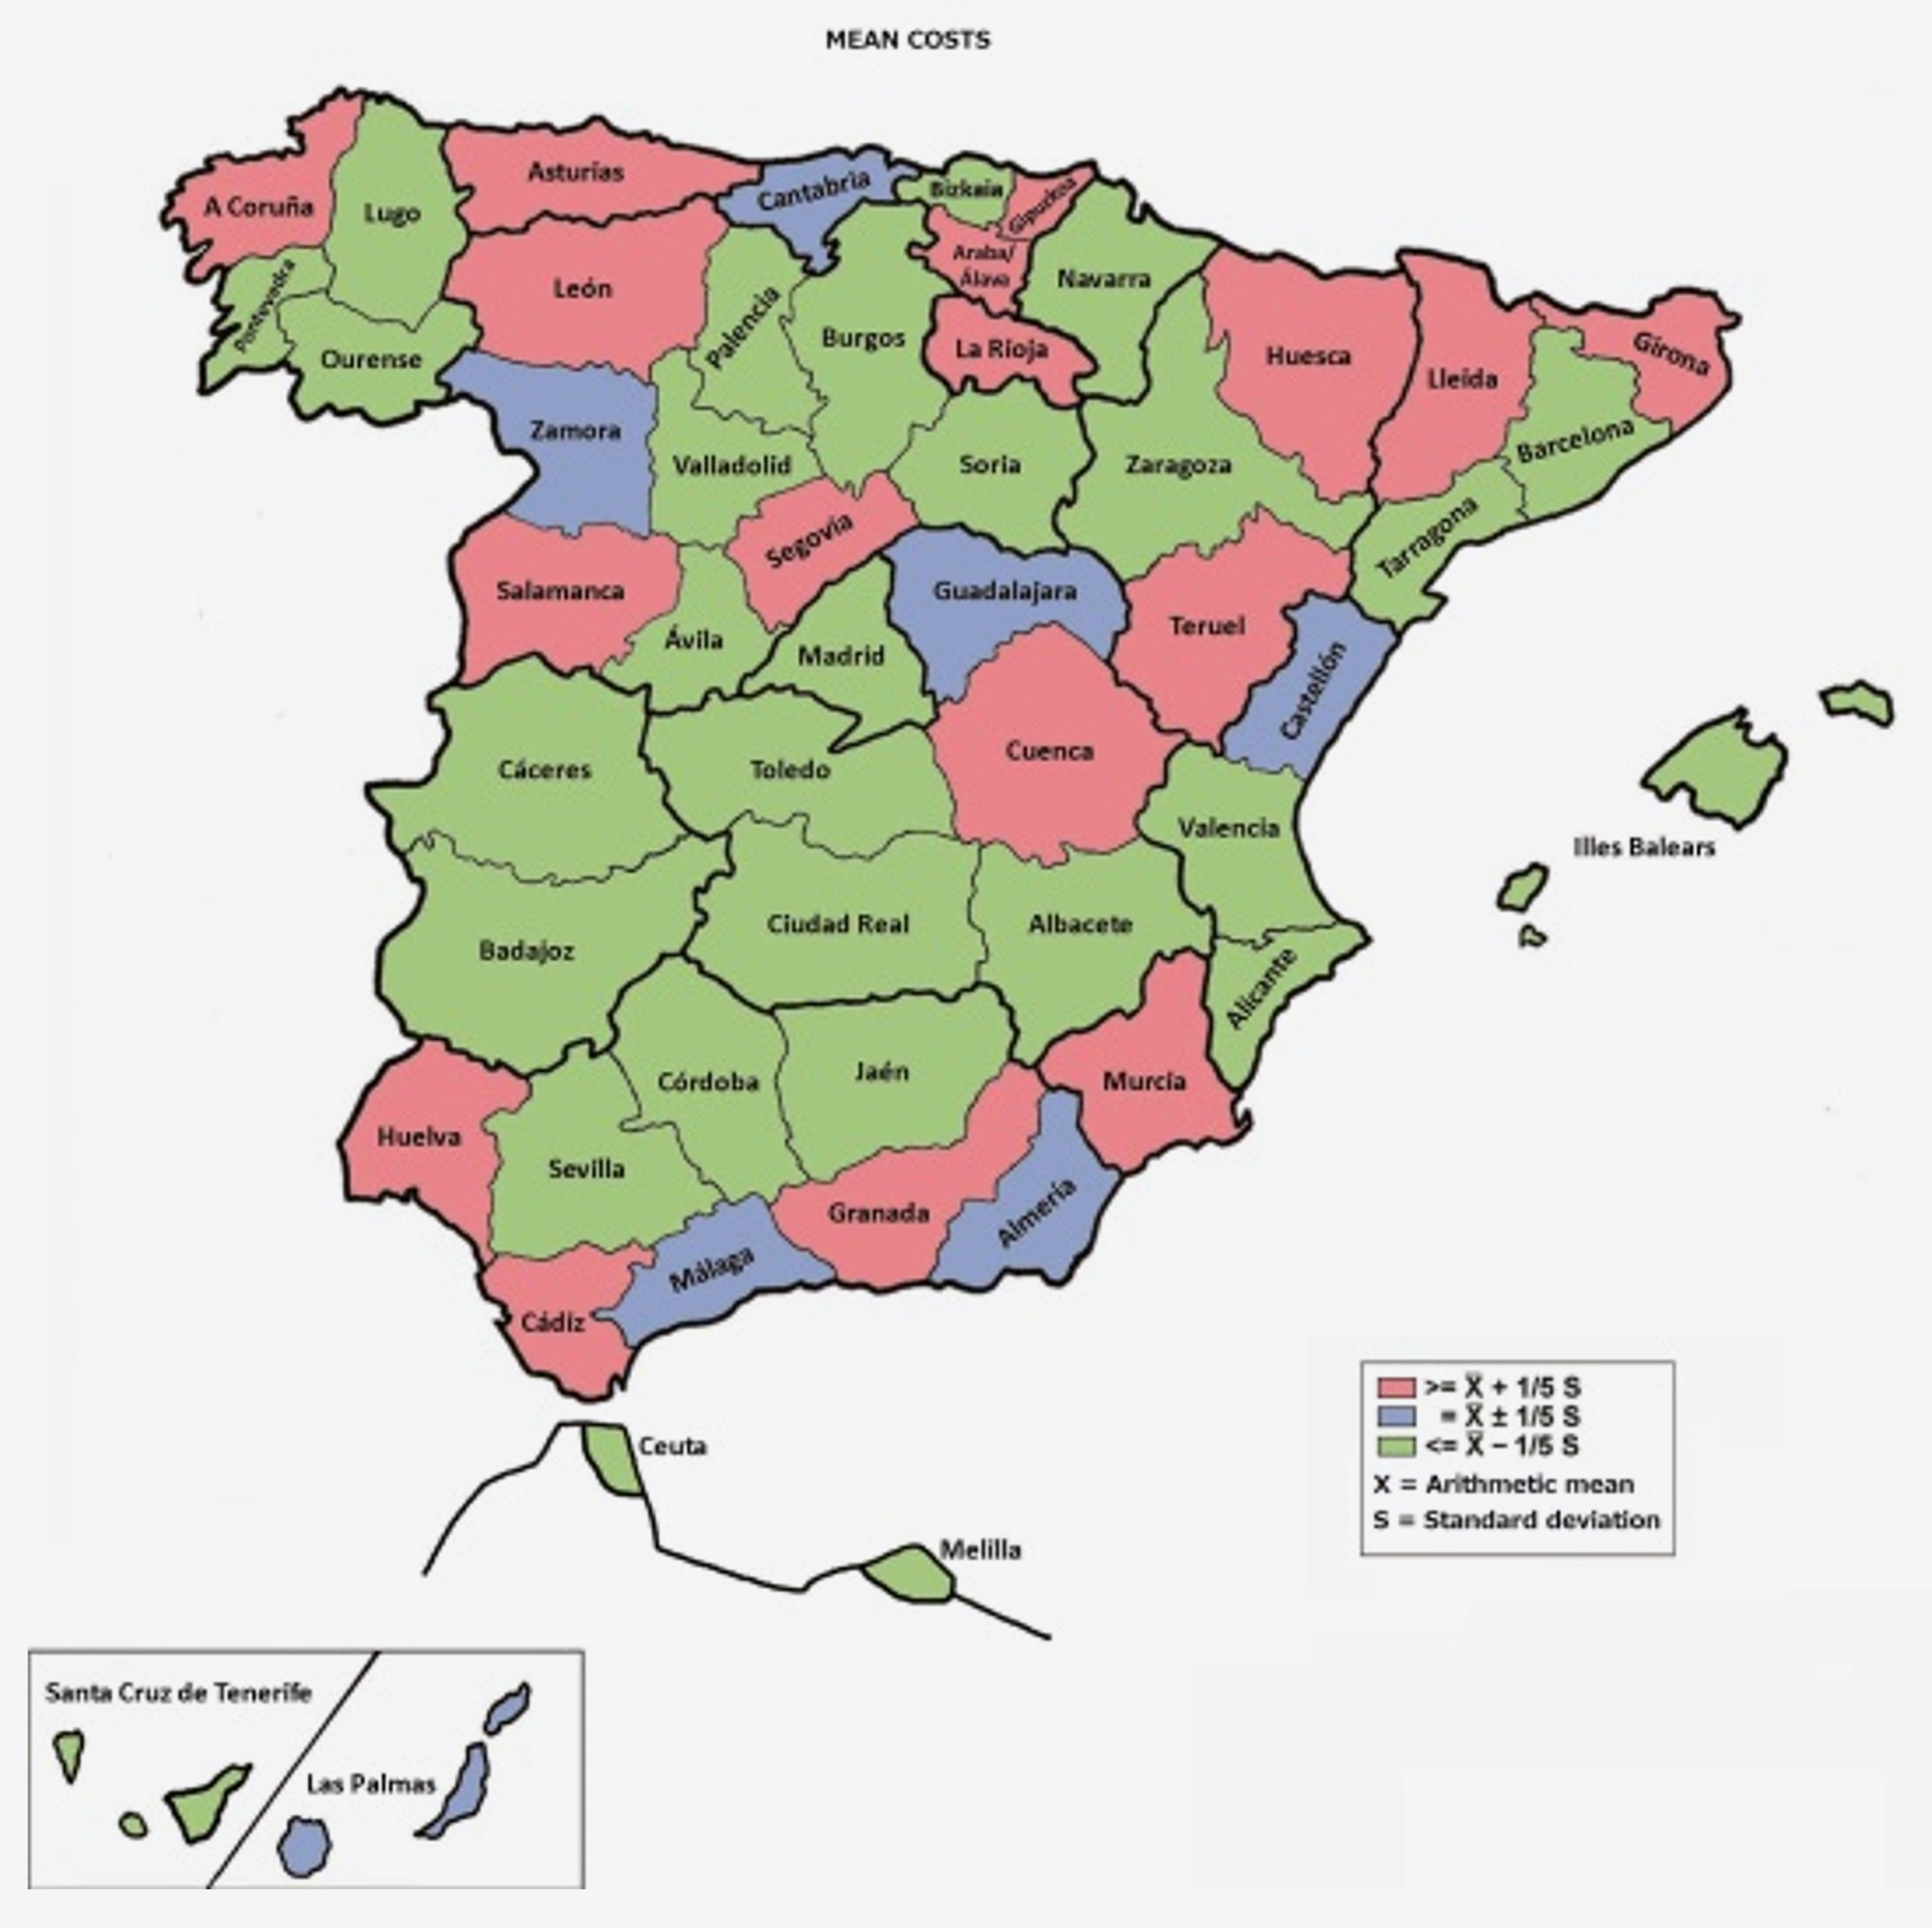
2. Maps showing number of claims, compensation paid out, and mean costs by province, respectively, as is reference to the number of standard deviations from the arithmetic mean, for the time series for 2001-2020. (Red provinces have values above 1.5 standard deviations from the national mean; green provinces have values below 1.5 standard deviations from the national mean, and blue provinces are in between)
Accidents caused by uninsured vehicles take place mainly in Spain's coastal regions and in Madrid, as the first map shows, causing indemnities to be concentrated in those same areas, map two.
The third map plots the distribution of mean costs.
Also, 1.3% of accidents took place outside Spain and represented 1.5% of the total compensation paid out.
3. Indemnities paid out by year of occurrence and type of loss
In current euros as of 31 December 2020
| Year of occurrence |
Property damage |
Personal injury |
Healthcare costs |
Court costs |
Total |
| 2001 |
34,712,522 |
100,405,567 |
5,316,658 |
8,324,548 |
148,759,295 |
| 2002 |
37,111,368 |
90,295,603 |
4,520,376 |
5,344,168 |
137,271,515 |
| 2003 |
39,392,383 |
97,560,654 |
6,160,858 |
3,523,945 |
146,637,840 |
| 2004 |
36,001,750 |
77,556,889 |
4,173,830 |
2,715,176 |
120,447,644 |
| 2005 |
34,408,933 |
68,619,860 |
4,115,084 |
2,183,200 |
109,327,077 |
| 2006 |
32,577,552 |
64,504,370 |
4,841,945 |
2,210,413 |
104,134,280 |
| 2007 |
31,244,210 |
62,197,670 |
3,489,070 |
2,050,387 |
98,981,337 |
| 2008 |
26,104,432 |
46,272,174 |
2,345,908 |
930,671 |
75,653,185 |
| 2009 |
24,699,850 |
45,745,011 |
2,404,960 |
1,042,437 |
73,892,257 |
| 2010 |
21,484,009 |
37,446,961 |
1,909,485 |
719,035 |
61,559,491 |
| 2011 |
18,148,374 |
30,100,020 |
1,739,199 |
570,103 |
50,557,697 |
| 2012 |
15,046,130 |
29,089,857 |
2,317,144 |
952,934 |
47,406,065 |
| 2013 |
14,072,367 |
28,318,834 |
1,413,434 |
594,625 |
44,399,260 |
| 2014 |
12,056,385 |
22,082,982 |
1,428,460 |
444,908 |
36,012,736 |
| 2015 |
11,602,968 |
25,523,559 |
1,587,799 |
485,550 |
39,199,877 |
| 2016 |
11,524,390 |
28,124,765 |
2,038,233 |
471,379 |
42,158,766 |
| 2017 |
11,532,455 |
21,814,970 |
2,154,534 |
180,468 |
35,682,427 |
| 2018 |
11,415,084 |
25,822,722 |
1,879,651 |
125,445 |
39,242,903 |
| 2019 |
11,884,078 |
19,147,413 |
1,883,940 |
45,187 |
32,960,617 |
| 2020 |
9,990,569 |
18,944,643 |
2,157,054 |
14,067 |
31,106,332 |
| Total |
445,009,809 |
939,574,524 |
57,877,621 |
32,928,645 |
1,475,390,599 |
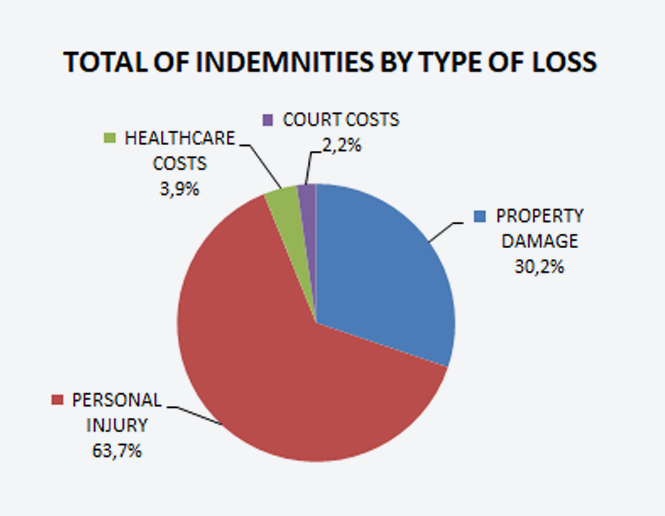
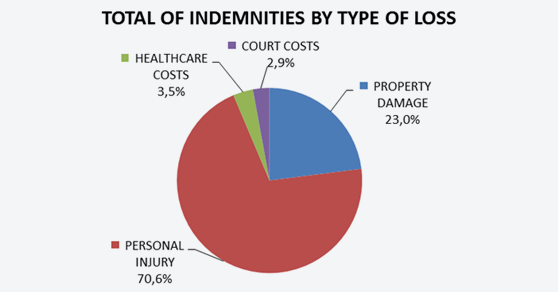
By type of damage caused, 63.7% of the indemnities paid out or for which provisions were made were personal injuries, with property damage (to vehicles and other property) accounting for the next 30.2%.
The pronounced and sustained decrease in the proportion of court costs in the total amount of indemnities paid out yearly is an effect of the speed with which the CCS is increasingly handling claims for compensation and its focus on achieving negotiated settlements.
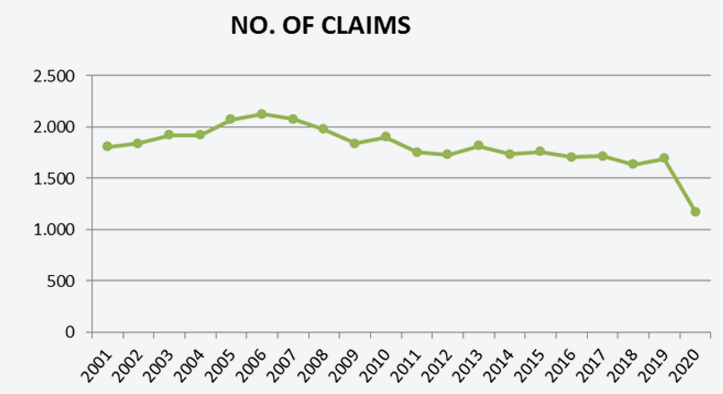
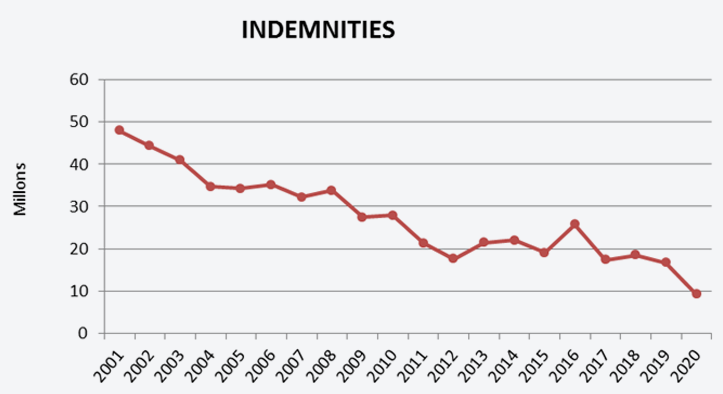
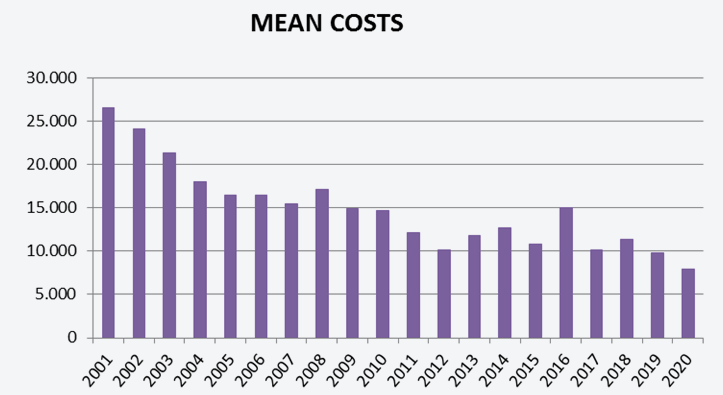
II. Unidentified vehicles
1. Number of claims, indemnities paid out, and mean costs for losses caused by unidentified vehicles paid for by the CCS by year of occurrence In current euros as of 31 December 2020
| Year |
Nº of claims |
Indemnities |
Mean costs |
| 2001 |
1,806 |
48,004,069 |
26,580 |
| 2002 |
1,839 |
44,285,178 |
24,081 |
| 2003 |
1,918 |
40,879,719 |
21,314 |
| 2004 |
1,919 |
34,668,567 |
18,066 |
| 2005 |
2,074 |
34,211,277 |
16,495 |
| 2006 |
2,126 |
35,100,880 |
16,510 |
| 2007 |
2,076 |
32,206,407 |
15,514 |
| 2008 |
1,976 |
33,798,565 |
17,105 |
| 2009 |
1,841 |
27,452,550 |
14,912 |
| 2010 |
1,903 |
27,943,963 |
14,684 |
| 2011 |
1,751 |
21,347,421 |
12,192 |
| 2012 |
1,727 |
17,578,770 |
10,179 |
| 2013 |
1,816 |
21,397,182 |
11,783 |
| 2014 |
1,735 |
21,985,805 |
12,672 |
| 2015 |
1,760 |
19,004,629 |
10,798 |
| 2016 |
1,707 |
25,694,098 |
15,052 |
| 2017 |
1,717 |
17,374,366 |
10,119 |
| 2018 |
1,632 |
18,490,884 |
11,330 |
| 2019 |
1,693 |
16,706,735 |
9,868 |
| 2020 |
1,172 |
9,242,369 |
7,886 |
| TOTAL |
36,188 |
547,373,433 |
15,126 |
The number of claims for this type of cover can be observed to have held relatively steady, a trend that is even more pronounced when claims incurred but not reported (IBNR) are added, mainly affecting the most recent years in the series. The compensation paid out follows a downward trend, and this too continues when indemnities for IBNR claims are considered.
Accordingly, mean costs have been falling as the years pass by. These costs are particularly high compared with other covers, since in most cases they involve personal injuries. It should be noted that according to the compulsory civil liability insurance Directive, EU Guarantee Funds take responsibility for paying compensation for property damage in accidents caused by unidentified vehicles only when significant personal injuries occur in those accidents. This provision arose from the need to prevent and combat potentially fraudulent claims placed with the Guarantee Fund. Correspondingly, in Spanish law compensation for property damage is payable only when there are personal injuries in the form of death, permanent disability, or temporary disability with hospitalisation for at least seven days.
These variables have been plotted in the Figures below.
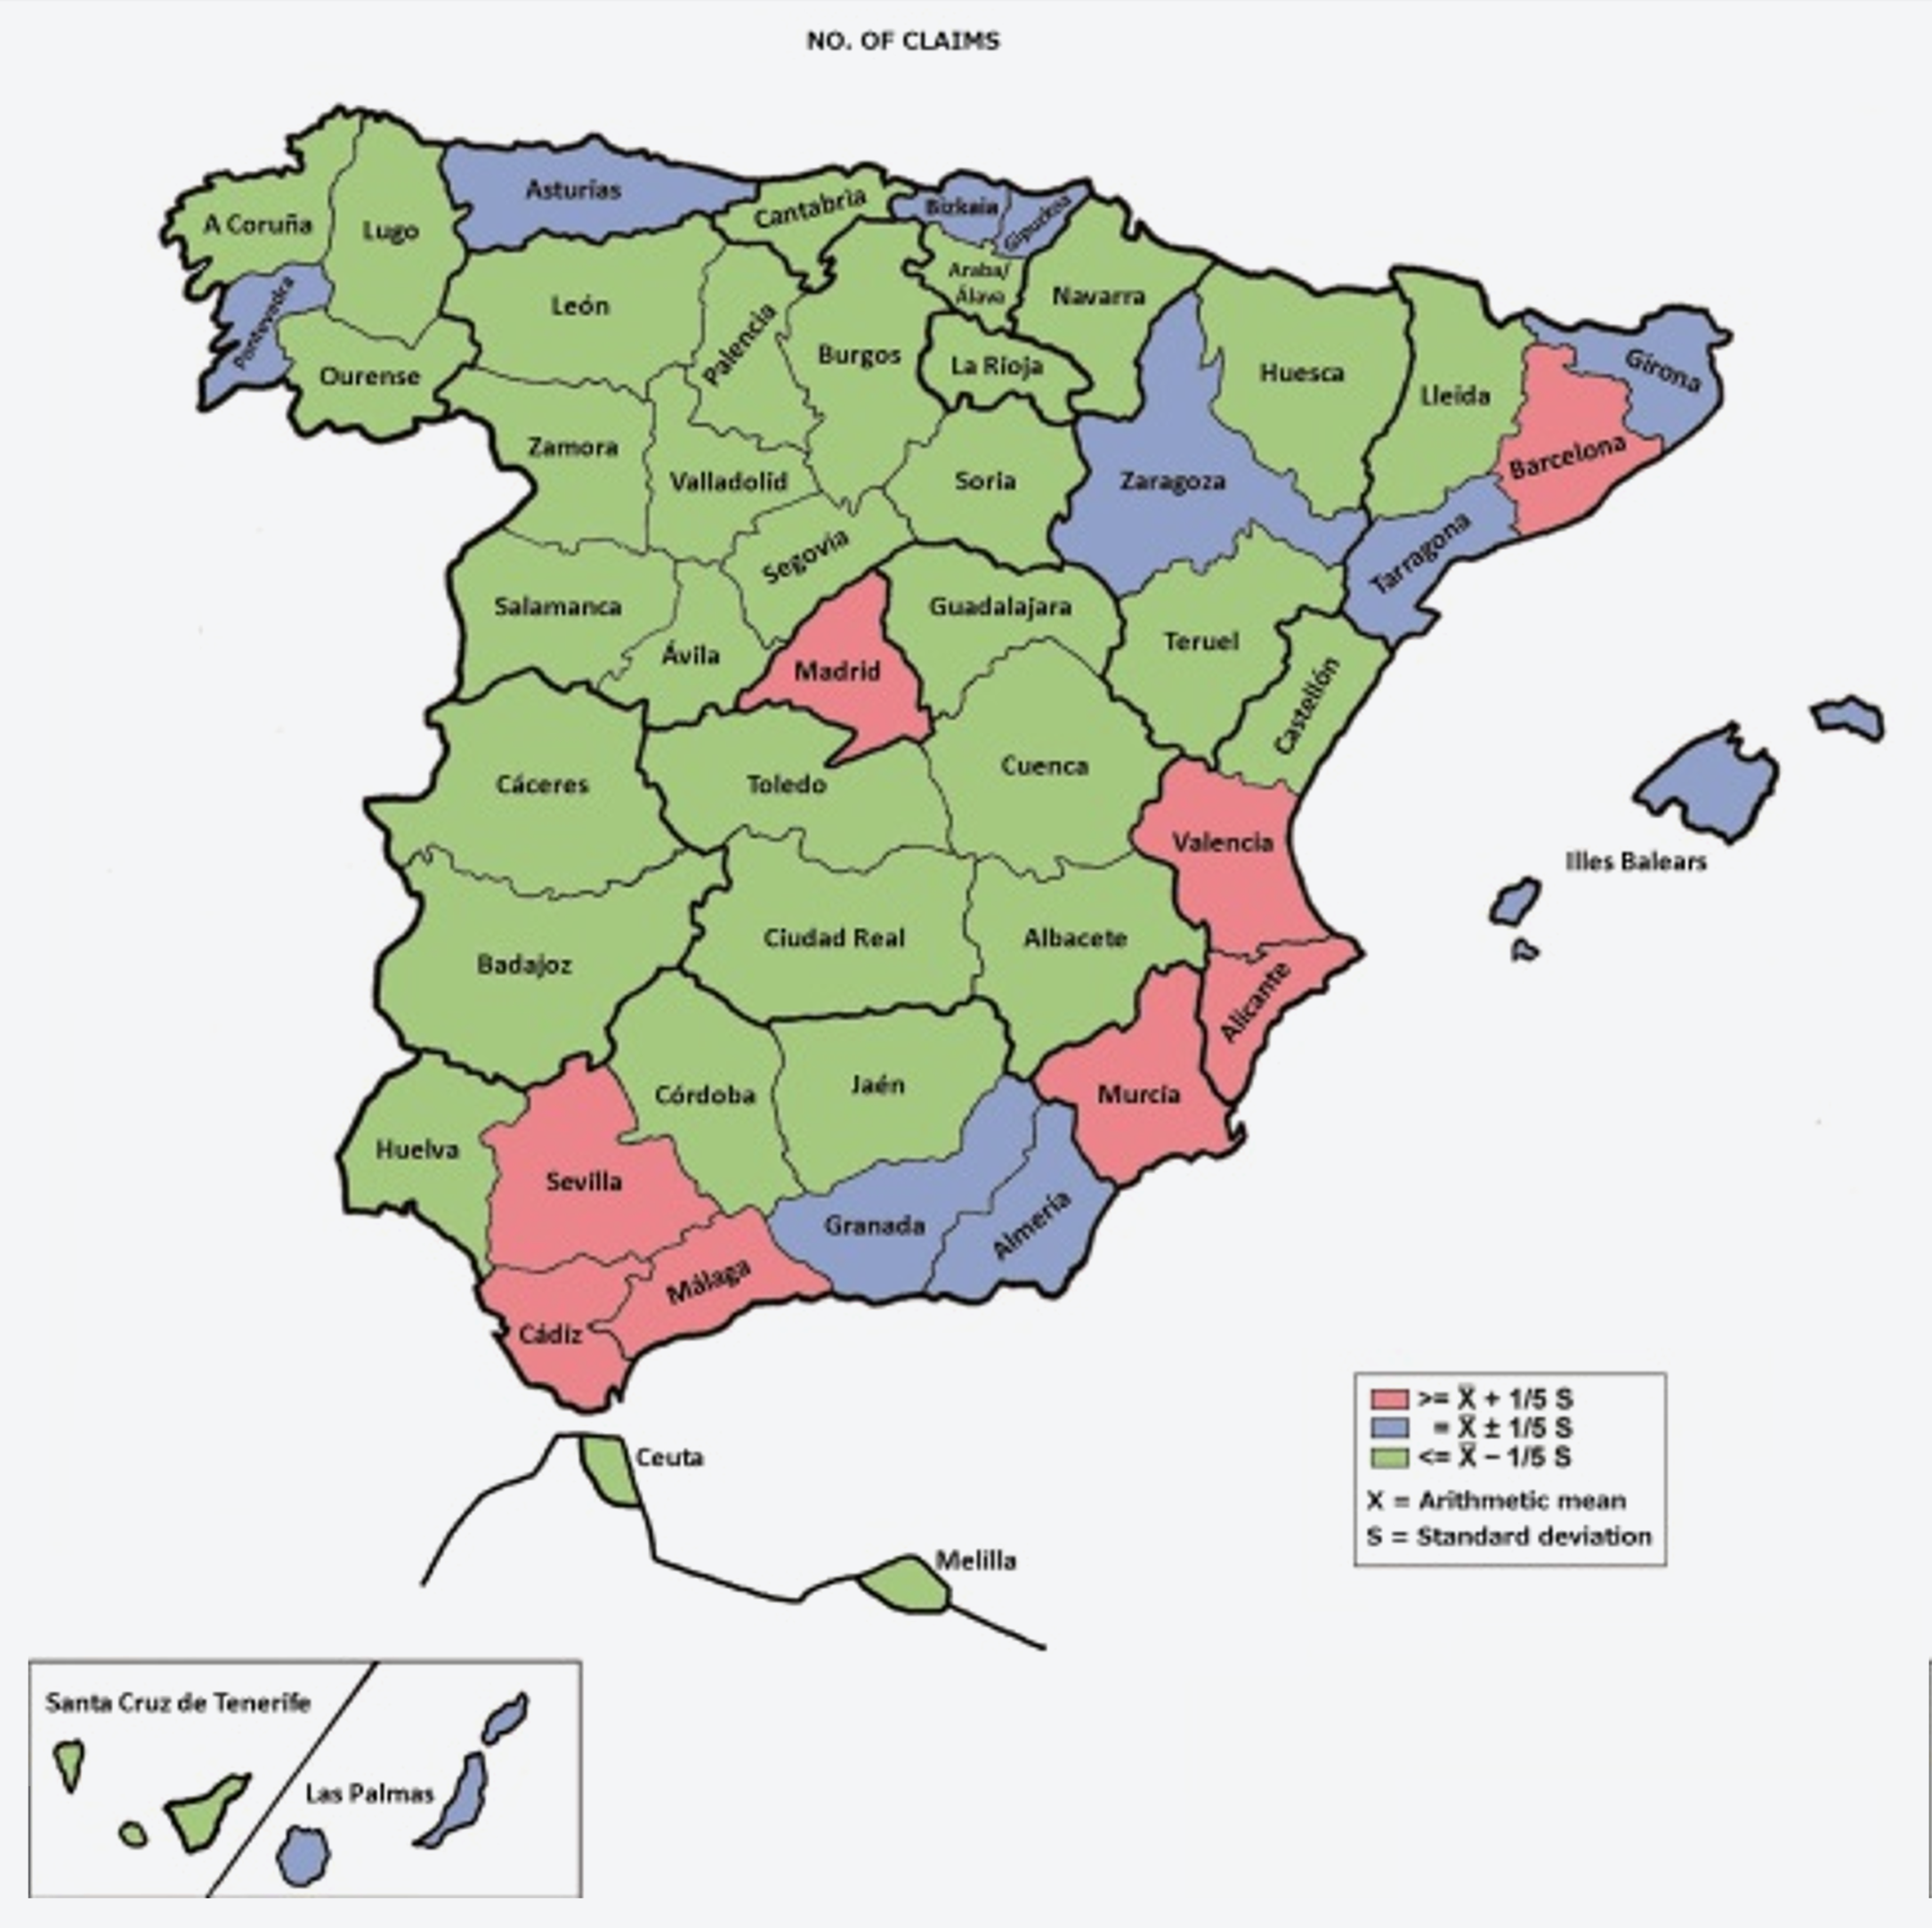
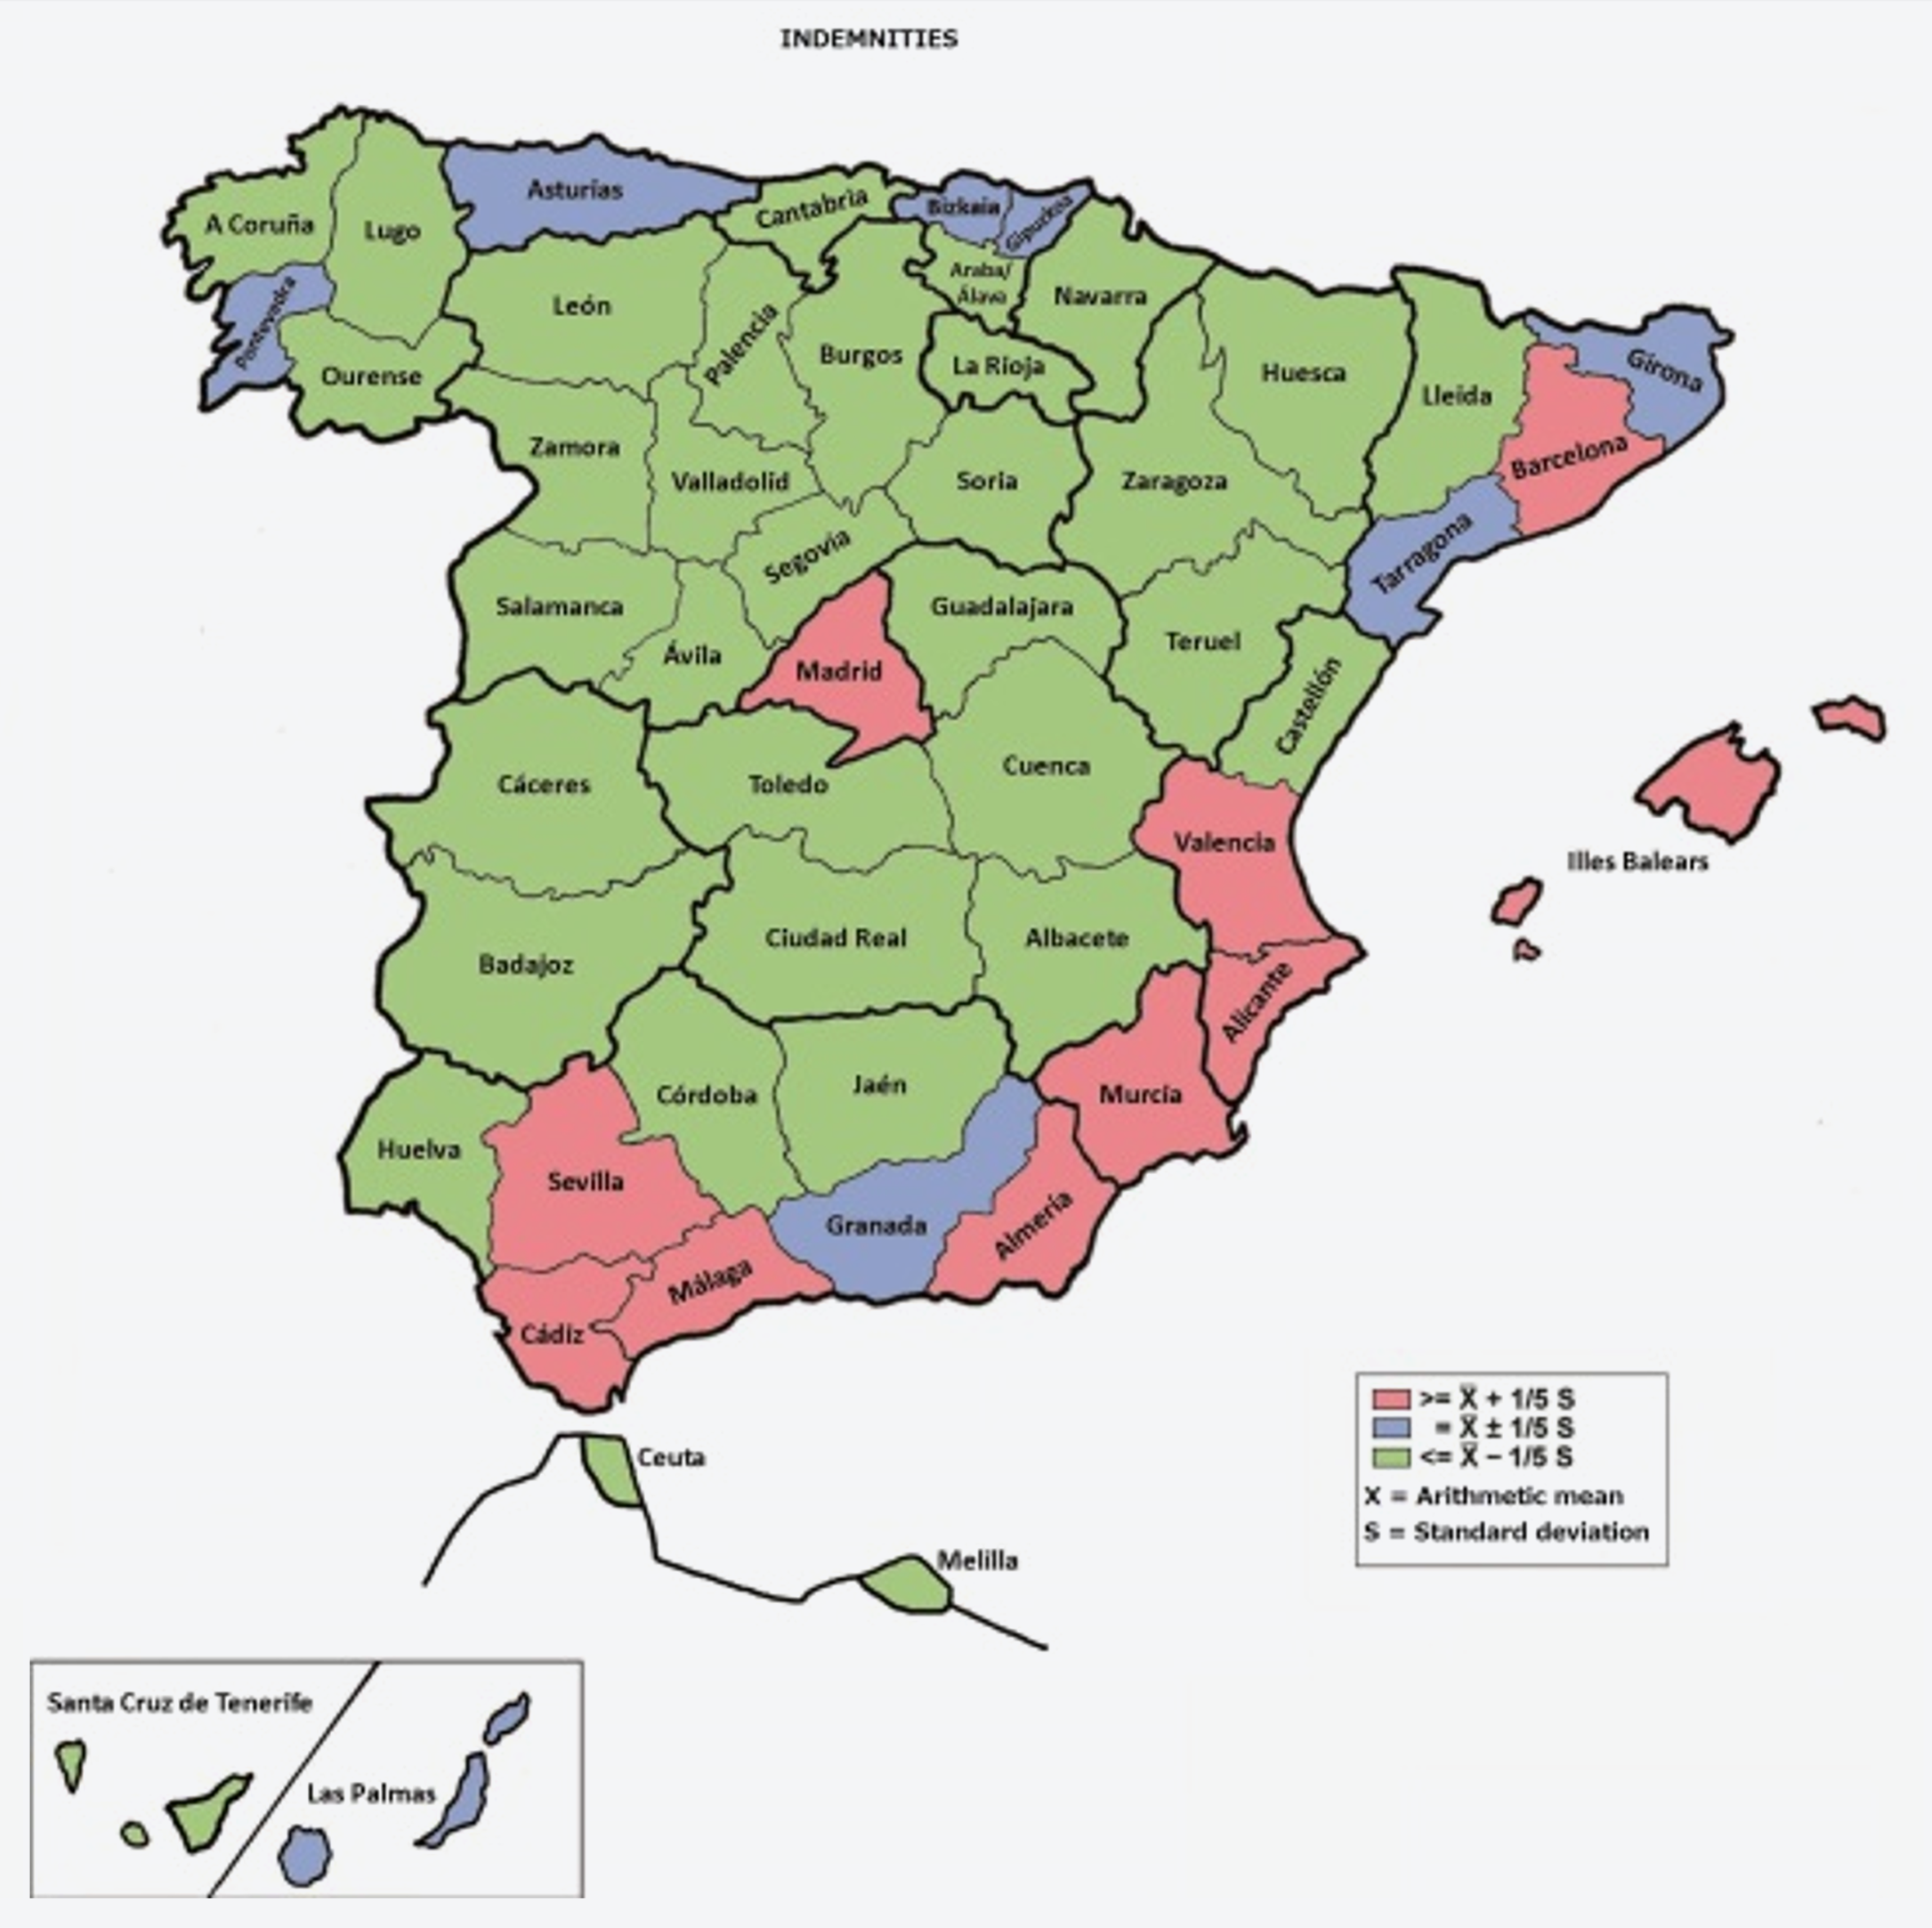
2. Maps showing number of claims, compensation paid out, and mean costs by province, respectively, as is reference to the number of standard deviations from the arithmetic mean, for the time series for 2001-2020. (Red provinces have values above 1.5 standard deviations from the national mean; green provinces have values below 1.5 standard deviations from the national mean, and blue provinces are in between)
The first map shows that losses caused by unidentified vehicles take place mainly in Andalusia, the Valencian Community, and Murcia Region, as well as in Madrid and Barcelona, causing indemnities to be concentrated in those same areas, as shown in map two.
The third map plots the distribution of mean costs.
3. Indemnities paid out by year of occurrence and type of loss
In current euros as of 31 December 2020
| Year of occurrence |
Property damage |
Personal injury |
Healthcare costs |
Court costs |
Total |
| 2001 |
10,824 |
44,000,083 |
742,956 |
3,250,206 |
48,004,069 |
| 2002 |
20,898 |
39,834,368 |
661,498 |
3,768,414 |
44,285,178 |
| 2003 |
26,070 |
38,493,054 |
523,951 |
1,836,644 |
40,879,719 |
| 2004 |
28,282 |
31,813,586 |
1,095,154 |
1,731,545 |
34,668,567 |
| 2005 |
32,741 |
31,982,262 |
783,130 |
1,413,144 |
34,211,277 |
| 2006 |
19,826 |
32,070,346 |
1,170,096 |
1,840,611 |
35,100,880 |
| 2007 |
179,427 |
29,954,310 |
607,422 |
1,465,248 |
32,206,407 |
| 2008 |
260,286 |
29,981,943 |
868,446 |
2,687,892 |
33,798,565 |
| 2009 |
209,191 |
26,126,077 |
565,516 |
551,765 |
27,452,550 |
| 2010 |
277,312 |
25,879,319 |
803,419 |
983,912 |
27,943,963 |
| 2011 |
78,658 |
20,040,189 |
444,922 |
783,651 |
21,347,421 |
| 2012 |
109,815 |
16,445,604 |
559,797 |
463,554 |
17,578,770 |
| 2013 |
110,497 |
20,016,211 |
738,642 |
531,831 |
21,397,182 |
| 2014 |
54,183 |
20,881,853 |
529,251 |
520,518 |
21,985,805 |
| 2015 |
175,615 |
17,961,599 |
451,943 |
415,473 |
19,004,629 |
| 2016 |
326,782 |
24,283,971 |
603,901 |
479,443 |
25,694,098 |
| 2017 |
75,906 |
16,514,965 |
602,506 |
180,989 |
17,374,366 |
| 2018 |
110,138 |
17,415,278 |
875,661 |
89,806 |
18,490,884 |
| 2019 |
121,388 |
15,832,967 |
732,393 |
19,986 |
16,706,735 |
| 2020 |
120,323 |
8,865,961 |
255,693 |
392 |
9,242,369 |
| Total |
2,348,162 |
508,393,947 |
13,616,300 |
23,015,025 |
547,373,433 |
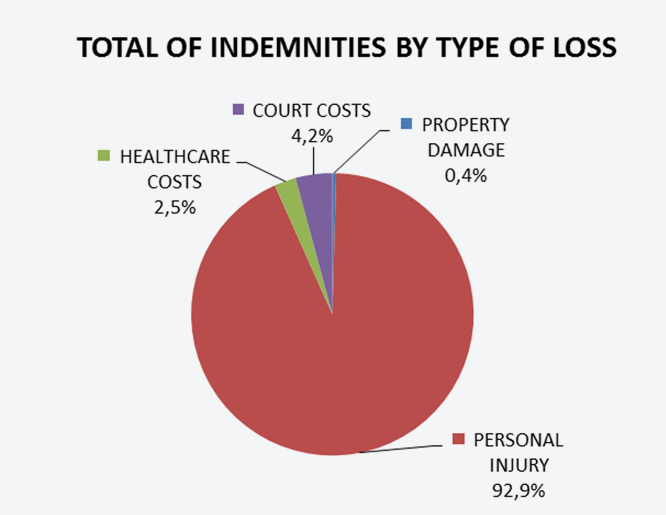
By type of damage caused, 92.9% of the indemnities paid out or for which provisions were made were personal injuries. Property damage made up only a small percentage compared to the other damage covers, because indemnities can only be collected when there are significant personal injuries.
This type of activity by the CCS as a Guarantee Fund also displays a decrease in court costs, on the one hand due to negotiated settlement of compensation claims and on the other due to the record of success in court proceedings the CCS has when indemnity proposals are rejected.
III. Stolen vehicles
1. Number of claims, indemnities paid out, and mean costs for losses caused by stolen vehicles by year of occurrence In current euros as of 31 December 2020
| Year |
Nº of claims |
Indemnities |
Mean costs |
| 2001 |
1,478 |
10,195,821 |
6,898 |
| 2002 |
1,469 |
9,176,865 |
6,247 |
| 2003 |
1,403 |
8,773,139 |
6,253 |
| 2004 |
1,203 |
8,095,204 |
6,729 |
| 2005 |
1,138 |
6,761,369 |
5,941 |
| 2006 |
1,115 |
7,274,589 |
6,524 |
| 2007 |
1,010 |
5,112,014 |
5,061 |
| 2008 |
1,000 |
6,371,028 |
6,371 |
| 2009 |
786 |
5,029,739 |
6,399 |
| 2010 |
698 |
3,416,361 |
4,895 |
| 2011 |
631 |
3,755,732 |
5,952 |
| 2012 |
568 |
3,514,183 |
6,187 |
| 2013 |
513 |
2,819,671 |
5,496 |
| 2014 |
408 |
2,531,512 |
6,205 |
| 2015 |
420 |
3,126,584 |
7,444 |
| 2016 |
424 |
1,864,700 |
4,398 |
| 2017 |
489 |
4,092,506 |
8,369 |
| 2018 |
504 |
3,148,166 |
6,246 |
| 2019 |
481 |
2,767,940 |
5,755 |
| 2020 |
328 |
2,845,252 |
8,675 |
| TOTAL |
16,066 |
100,672,374 |
6,266 |
The number of claims and the corresponding amount of compensation paid out for this type of cover have been falling. This trend holds true even when the number of claims filed for losses occurring in the period that have not yet been claimed is added.
Mean costs have held steady.
These variables have been plotted in the Figures below.
2. Maps showing loss occurrence by province, as is reference to the number of standard deviations from the arithmetic mean, for the time series for 2001-2020. (Red provinces have values above 1.5 standard deviations from the national mean; green provinces have values below 1.5 standard deviations from the national mean, and blue provinces are in between)
Accidents caused by stolen vehicles take place mainly in Spain's coastal regions and in Madrid, as the first map shows, causing indemnities to be concentrated in those same areas, map two.
The third map plots the distribution of mean costs.
3. Indemnities paid out by year of occurrence and type of loss
In current euros as of 31 December 2020
| Year of occurrence |
Property damage |
Personal injury |
Healthcare costs |
Court costs |
Total |
| 2001 |
3,677,669 |
5,597,729 |
194,538 |
725,884 |
10,195,821 |
| 2002 |
3,993,093 |
4,598,264 |
104,135 |
481,372 |
9,176,865 |
| 2003 |
3,721,641 |
4,269,882 |
379,633 |
401,983 |
8,773,139 |
| 2004 |
3,660,931 |
4,039,983 |
153,884 |
240,407 |
8,095,204 |
| 2005 |
2,945,793 |
3,411,907 |
129,678 |
273,991 |
6,761,369 |
| 2006 |
3,163,147 |
3,743,176 |
136,750 |
231,515 |
7,274,589 |
| 2007 |
2,670,068 |
2,268,138 |
79,807 |
94,001 |
5,112,014 |
| 2008 |
2,898,912 |
3,215,325 |
176,229 |
80,563 |
6,371,028 |
| 2009 |
2,212,673 |
2,694,839 |
76,377 |
45,850 |
5,029,739 |
| 2010 |
1,932,973 |
1,276,788 |
160,149 |
46,452 |
3,416,361 |
| 2011 |
1,499,315 |
2,135,718 |
97,323 |
23,377 |
3,755,732 |
| 2012 |
1,309,589 |
2,074,102 |
123,010 |
7,481 |
3,514,183 |
| 2013 |
1,275,818 |
1,440,712 |
50,489 |
52,652 |
2,819,671 |
| 2014 |
958,458 |
1,486,437 |
57,518 |
29,099 |
2,531,512 |
| 2015 |
1,055,990 |
1,897,917 |
156,196 |
16,481 |
3,126,584 |
| 2016 |
1,055,230 |
765,271 |
35,276 |
8,924 |
1,864,700 |
| 2017 |
1,324,683 |
2,684,055 |
73,181 |
10,587 |
4,092,506 |
| 2018 |
1,412,031 |
1,703,025 |
22,723 |
10,387 |
3,148,166 |
| 2019 |
1,355,358 |
1,379,129 |
29,630 |
3,822 |
2,767,940 |
| 2020 |
1,021,288 |
1,652,207 |
171,757 |
0 |
2,845,252 |
| Total |
43,144,661 |
52,334,603 |
2,408,284 |
2,784,827 |
100,672,374 |
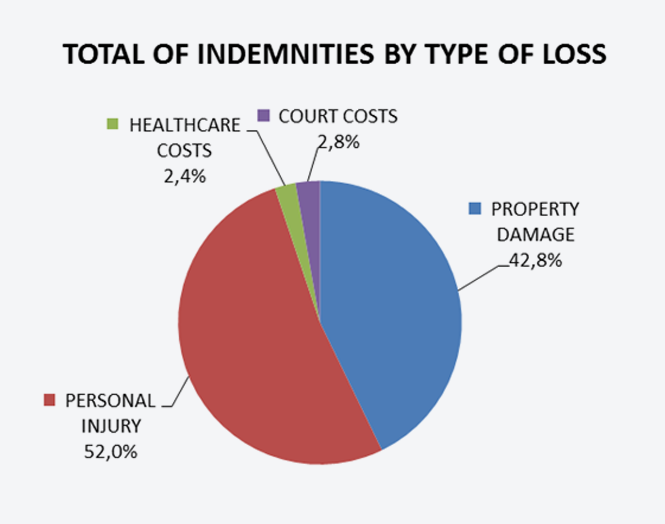
By type of damage caused, 52.0% of the indemnities paid out or for which provisions were made were personal injuries, followed by property damage (to vehicles or other property) accounting for 42.8%.
The same observations made concerning the appreciable decline in court costs in respect of losses caused by uninsured vehicles being driven unlawfully or unidentified vehicles can also be made for this third cover by the CCS.
IV. Vehicles insured by companies being wound up
1. Number of claims, indemnites paid out, and mean costs caused by vehicles insured by companies being wound up by year of occurrence In current euros as of 31 December 2020
| Year |
Nº of claims |
Indemnities |
Mean costs |
| 2001 |
87 |
785,048 |
9,024 |
| 2002 |
79 |
2,092,963 |
26,493 |
| 2003 |
62 |
1,320,827 |
21,304 |
| 2004 |
79 |
2,628,306 |
33,270 |
| 2005 |
92 |
2,103,240 |
22,861 |
| 2006 |
154 |
3,126,512 |
20,302 |
| 2007 |
303 |
4,491,471 |
14,823 |
| 2008 |
829 |
7,243,542 |
8,738 |
| 2009 |
3,956 |
23,683,274 |
5,987 |
| 2010 |
2,673 |
7,917,538 |
2,962 |
| 2011 |
18 |
250,631 |
13,924 |
| 2012 |
49 |
395,371 |
8,069 |
| 2013 |
21 |
92,900 |
4,424 |
| 2014 |
- |
- |
- |
| 2015 |
- |
- |
- |
| 2016 |
- |
- |
- |
| 2017 |
- |
- |
- |
| 2018 |
- |
- |
- |
| 2019 |
- |
- |
- |
| 2020 |
- |
- |
- |
| TOTAL |
8,402 |
56,131,623 |
6,681 |
The last insurance company offering civil liability insurance for motor vehicles was wound up in 2013.
No plots of the time or geographic distributions or distributions by type of loss have been prepared because the numbers are not significant.
Section 3: summary and results, time series for 2001-2020
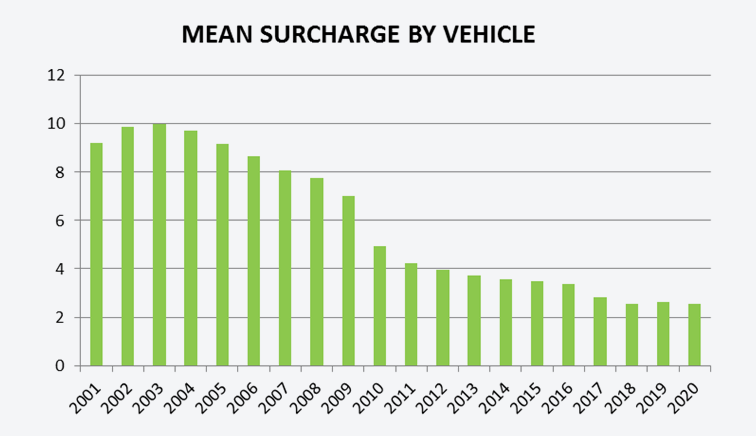
I. Risk exposure summary
In current euros as of 31 December 2020
| Year |
Total motor vehicle |
FIVA |
Surcharges |
Mean surcharge by FIVA vehicle |
| 2001 |
26,056,629 |
21,958,146 |
201,866,890 |
9.19 |
| 2002 |
27,109,974 |
22,408,462 |
220,730,726 |
9.85 |
| 2003 |
27,313,045 |
23,338,997 |
232,572,154 |
9.96 |
| 2004 |
28,674,687 |
24,594,286 |
238,720,434 |
9.71 |
| 2005 |
29,969,049 |
25,747,209 |
236,054,609 |
9.17 |
| 2006 |
31,397,185 |
27,085,809 |
234,247,697 |
8.65 |
| 2007 |
32,748,871 |
28,347,255 |
228,085,841 |
8.05 |
| 2008 |
33,379,909 |
28,839,766 |
222,913,306 |
7.73 |
| 2009 |
33,208,174 |
28,788,437 |
201,281,472 |
6.99 |
| 2010 |
33,376,242 |
28,700,325 |
141,521,069 |
4.93 |
| 2011 |
33,498,499 |
28,913,319 |
121,899,951 |
4.22 |
| 2012 |
33,372,871 |
28,724,457 |
113,408,902 |
3.95 |
| 2013 |
33,023,952 |
28,597,783 |
106,367,990 |
3.72 |
| 2014 |
33,037,091 |
28,801,437 |
102,803,917 |
3.57 |
| 2015 |
33,412,894 |
29,125,792 |
101,181,772 |
3.47 |
| 2016 |
34,093,990 |
29,838,361 |
101,186,323 |
3.39 |
| 2017 |
34,890,527 |
30,613,146 |
86,306,121 |
2.82 |
| 2018 |
35,663,427 |
31,452,863 |
80,629,006 |
2.56 |
| 2019 |
36,343,283 |
31,776,323 |
83,211,215 |
2.62 |
| 2020 |
36,660,225 |
32,023,762 |
82,045,100 |
2.56 |
| TOTAL |
647,230,524 |
559,675,935 |
3,137,034,493 |
5.61 |
The figure for the total number of motor vehicles for 2020 is provisional.
The rising trend in the number de insured vehicles (FIVA) compared with the descending trend in surcharges shows that the mean surcharge per policy has decreased from 9.19 euros per policy in 2001 to 2.56 euros per policy in 2020, values adjusted as of 31 December 2020.
The plots are set out below:
II. Loss rate summary
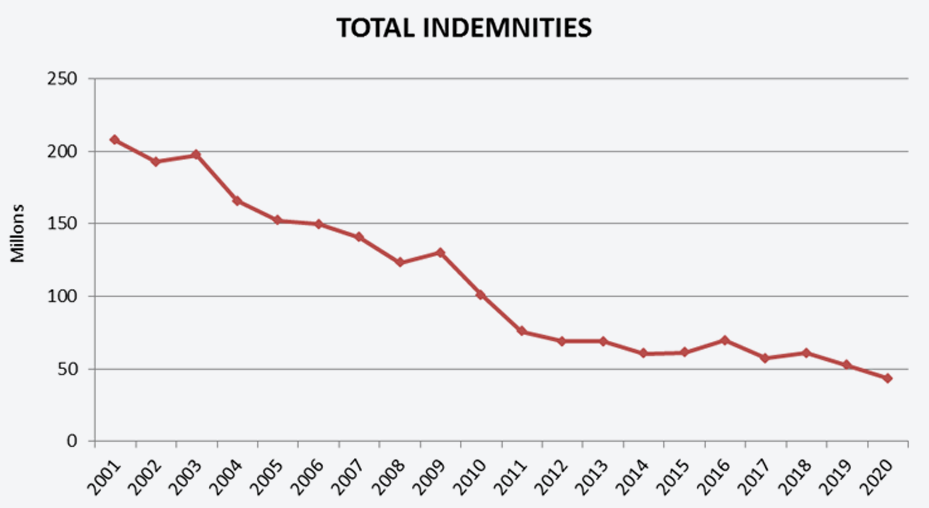
Guarantee fund's indemnities In current euros as of 31 December 2020
| Year |
Uninsured |
Unidentified |
Stolen |
Companies being wound-up |
Total |
| 2001 |
148,759,295 |
48,004,069 |
10,195,821 |
785,048 |
207,744,232 |
| 2002 |
137,271,515 |
44,285,178 |
9,176,865 |
2,092,963 |
192,826,520 |
| 2003 |
146,637,840 |
40,879,719 |
8,773,139 |
1,320,827 |
197,611,524 |
| 2004 |
120,447,644 |
34,668,567 |
8,095,204 |
2,628,306 |
165,839,721 |
| 2005 |
109,327,077 |
34,211,277 |
6,761,369 |
2,103,240 |
152,402,963 |
| 2006 |
104,134,280 |
35,100,880 |
7,274,589 |
3,126,512 |
149,636,261 |
| 2007 |
98,981,337 |
32,206,407 |
5,112,014 |
4,491,471 |
140,791,229 |
| 2008 |
75,653,185 |
33,798,565 |
6,371,028 |
7,243,542 |
123,066,321 |
| 2009 |
73,892,257 |
27,452,550 |
5,029,739 |
23,683,274 |
130,057,821 |
| 2010 |
61,559,491 |
27,943,963 |
3,416,361 |
7,917,538 |
100,837,353 |
| 2011 |
50,557,697 |
21,347,421 |
3,755,732 |
250,631 |
75,911,481 |
| 2012 |
47,406,065 |
17,578,770 |
3,514,183 |
395,371 |
68,894,389 |
| 2013 |
44,399,260 |
21,397,182 |
2,819,671 |
92,900 |
68,709,012 |
| 2014 |
36,012,736 |
21,985,805 |
2,531,512 |
0 |
60,530,052 |
| 2015 |
39,199,877 |
19,004,629 |
3,126,584 |
0 |
61,331,090 |
| 2016 |
42,158,766 |
25,694,098 |
1,864,700 |
0 |
69,717,564 |
| 2017 |
35,682,427 |
17,374,366 |
4,092,506 |
0 |
57,149,299 |
| 2018 |
39,242,903 |
18,490,884 |
3,148,166 |
0 |
60,881,952 |
| 2019 |
32,960,617 |
16,706,735 |
2,767,940 |
0 |
52,435,292 |
| 2020 |
31,106,332 |
9,242,369 |
2,845,252 |
0 |
43,193,953 |
| TOTAL |
1,475,390,599 |
547,373,433 |
100,672,374 |
56,131,623 |
2,179,568,029 |
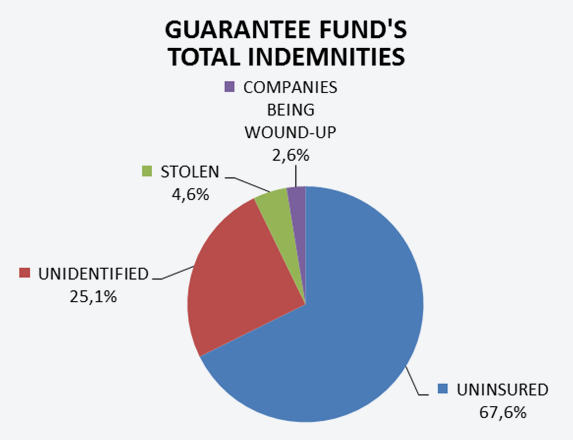
| |
67.7% |
25.1% |
4.6% |
2.6% |
100% |
The preceding Table shows indemnities paid out by the Guarantee Fund by type of cover, with payments for uninsured vehicles accounting for the largest share at 67.7% of the total compensation, followed by payments for unidentified vehicles, at 25.1% of pay-outs.
Even including compensation for IBNR losses, the trend is downward.
Total indemnities paid out by the Guarantee Fund are broken down in the following Figure:
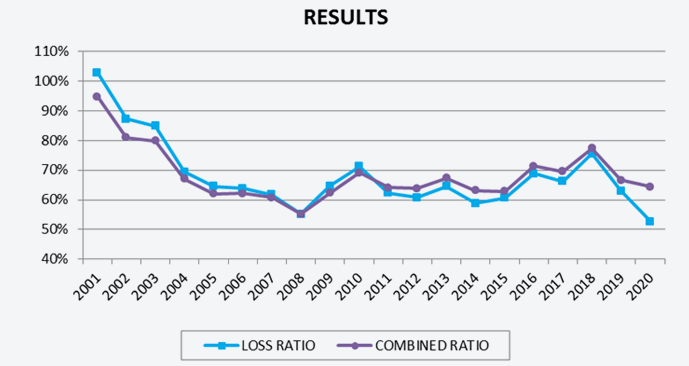
III. Results
| Year |
Loss ratio |
Combined ratio |
| 2001 |
103% |
95% |
| 2002 |
87% |
81% |
| 2003 |
85% |
80% |
| 2004 |
69% |
67% |
| 2005 |
65% |
62% |
| 2006 |
64% |
62% |
| 2007 |
62% |
61% |
| 2008 |
55% |
55% |
| 2009 |
65% |
62% |
| 2010 |
71% |
69% |
| 2011 |
62% |
64% |
| 2012 |
61% |
64% |
| 2013 |
65% |
67% |
| 2014 |
59% |
63% |
| 2015 |
61% |
63% |
| 2016 |
69% |
71% |
| 2017 |
66% |
70% |
| 2018 |
76% |
77% |
| 2019 |
63% |
67% |
| 2020 |
53% |
64% |
| TOTAL |
69% |
68% |
The first column is the loss ratio between the loss, sums paid out or for which provisions were made for claims filed, i.e., excluding IBNR provisions, and the surcharges charged, broken down by year of occurrence of the loss. The result gives a mean loss ratio of 69%.
The second column combines the IBNR provisions, expenses charged to benefits, operating expenses, and other technical costs less loss recoveries. The mean combined ratio for the time series is 68%.